Performance Management
|
Apr. 30, 2026 |
| Investor Shares | FAM Value Fund |
|
| Prospectus [Line Items] |
|
| Bar Chart and Performance Table [Heading] |
Annual
Total Return
|
| Performance Narrative [Text Block] |
The
following bar chart and table show some indication of the risks of investing in the Fund. The bar chart shows changes in the Investor
Shares performance since 2016. The table shows the Investor Shares average annual returns (before and after taxes) for the 1 year, 5-year
and 10-year periods ended December 31, 2025 and compared to those of the S&P 500® Index, the Fund’s primary
benchmark index as well as those of the Russell Midcap® Index, which is an additional benchmark index that the Fund uses
for comparative performance purposes. The
Fund’s past performance (before and after taxes) is not necessarily an indication of how the Fund will perform in the future.
Updated performance information may be obtained at the Fund’s
website fenimoreasset.com.
|
| Performance Past Does Not Indicate Future [Text] |
The
Fund’s past performance (before and after taxes) is not necessarily an indication of how the Fund will perform in the future.
|
| Performance Information Illustrates Variability of Returns [Text] |
The
following bar chart and table show some indication of the risks of investing in the Fund. The bar chart shows changes in the Investor
Shares performance since 2016. The table shows the Investor Shares average annual returns (before and after taxes) for the 1 year, 5-year
and 10-year periods ended December 31, 2025 and compared to those of the S&P 500® Index, the Fund’s primary
benchmark index as well as those of the Russell Midcap® Index, which is an additional benchmark index that the Fund uses
for comparative performance purposes.
|
| Bar Chart [Heading] |
FAM VALUE FUND Investor Shares
|
| Bar Chart [Table] |
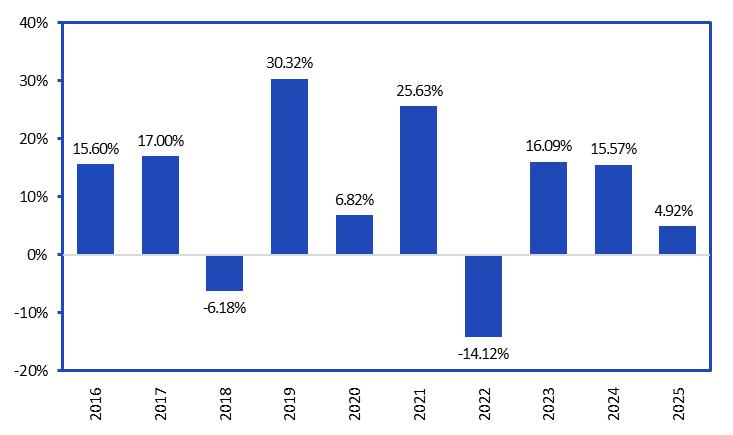
| Years |
Returns |
| 2016 |
15.60% |
| 2017 |
17.00% |
| 2018 |
-6.18% |
| 2019 |
30.32% |
| 2020 |
6.82% |
| 2021 |
25.63% |
| 2022 |
-14.12% |
| 2023 |
16.09% |
| 2024 |
15.57% |
| 2025 |
4.92% |
|
| Bar Chart Closing [Text Block] |
Best Quarter (2Q’20):
15.75%
Worst Quarter (1Q’20):
-23.73%
|
| Highest Quarterly Return, Label [Optional Text] |
Best Quarter
|
| Highest Quarterly Return |
15.75%
|
| Highest Quarterly Return, Date |
Jun. 30, 2020
|
| Lowest Quarterly Return, Label [Optional Text] |
Worst Quarter
|
| Lowest Quarterly Return |
(23.73%)
|
| Lowest Quarterly Return, Date |
Mar. 31, 2020
|
| Performance Table Heading |
AVERAGE
TOTAL ANNUAL RETURN
(for the periods ended December 31,
2025)
|
| Performance Table Uses Highest Federal Rate |
The after-tax returns shown in the table are calculated using the historical highest individual federal marginal income tax rates, and do not reflect the impact of state and local taxes.
|
| Performance Table Not Relevant to Tax Deferred |
Actual after-tax returns depend on the investor’s tax situation and may differ from those shown. The after-tax returns are not relevant to investors who hold their Fund shares through tax-deferred arrangements such as 401(k) plans or individual retirement accounts, or to investors who are tax exempt.
|
| Performance [Table] |
| | |
| |
| |
|
AVERAGE
TOTAL ANNUAL RETURN
(for the periods ended December 31,
2025) | |
Investor Shares |
| | |
1 YEAR | |
5 YEARS | |
10 YEARS |
| Return before taxes | |
4.92% | |
8.72% | |
10.37% |
| Return after taxes on distributions | |
3.77% | |
7.50% | |
9.13% |
| Return after taxes on distributions
and sale of fund shares | |
3.76% | |
6.77% | |
8.29% |
| S&P 500® Index* | |
17.88% | |
14.42% | |
14.82% |
| Russell MidCap® Index* | |
10.60% | |
8.67% | |
11.01% |
| * | In
connection with applicable mutual performance disclosure requirements, the Fund has adopted
the use of the S&P 500® Index as its primary comparative benchmark performance
index and it has adopted the use of the Russell Midcap® Index as an additional
comparative benchmark performance index. The Russell Midcap® Index generally
reflects the market sectors in which the Fund primarily invests and the S&P 500®
Index is a broad-based securities markets index that is generally representative of the overall
domestic US equity markets as a whole. |
|
| Performance Table One Class of after Tax Shown [Text] |
After-tax returns are shown for the Investor Class and after-tax returns for other classes will vary.
|
| Performance Table Closing [Text Block] |
The after-tax returns shown in the table are calculated using the historical highest individual federal marginal income tax rates, and do not reflect the impact of state and local taxes. Actual after-tax returns depend on the investor’s tax situation and may differ from those shown. The after-tax returns are not relevant to investors who hold their Fund shares through tax-deferred arrangements such as 401(k) plans or individual retirement accounts, or to investors who are tax exempt. After-tax returns are shown for the Investor Class and after-tax returns for other classes will vary.
|
| Performance Availability Website Address [Text] |
fenimoreasset.com
|
| Investor Shares | SUMMARY SECTION |
|
| Prospectus [Line Items] |
|
| Bar Chart and Performance Table [Heading] |
Annual Total Return
|
| Performance Narrative [Text Block] |
The
following bar chart and table show some indication of the risks of investing in the Fund.
The bar chart shows changes in the Investor Shares performance since 2016. The table shows
the Investor Shares average annual returns (before and after taxes) for the 1 year, 5-year
and 10-year periods ended December 31, 2025 and compared to those of the S&P 500®
Index, the Fund’s primary benchmark index as well as those of the Russell Midcap®
Index, which is an additional benchmark index that the Fund uses for comparative performance
purposes. The
Fund’s past performance (before and after taxes) is not necessarily an indication of
how the Fund will perform in the future. Updated
performance information may be obtained at the Fund’s website fenimoreasset.com.
|
| Performance Past Does Not Indicate Future [Text] |
The
Fund’s past performance (before and after taxes) is not necessarily an indication of
how the Fund will perform in the future.
|
| Performance Information Illustrates Variability of Returns [Text] |
The
following bar chart and table show some indication of the risks of investing in the Fund.
The bar chart shows changes in the Investor Shares performance since 2016. The table shows
the Investor Shares average annual returns (before and after taxes) for the 1 year, 5-year
and 10-year periods ended December 31, 2025 and compared to those of the S&P 500®
Index, the Fund’s primary benchmark index as well as those of the Russell Midcap®
Index, which is an additional benchmark index that the Fund uses for comparative performance
purposes.
|
| Bar Chart [Heading] |
FAM DIVIDEND FOCUS FUND Investor Shares
|
| Bar Chart [Table] |
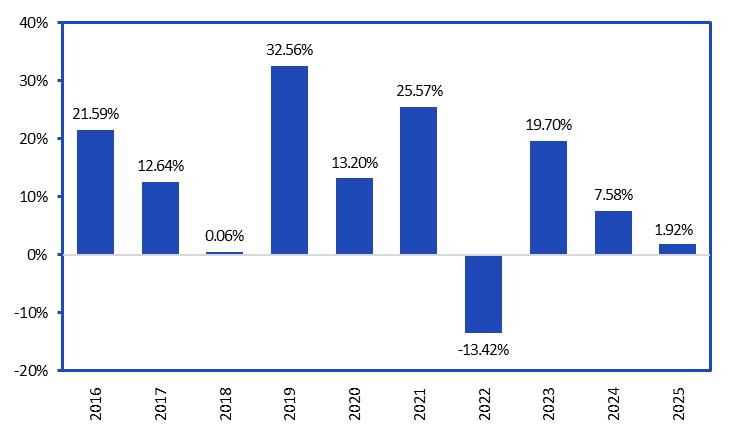
| Years |
Returns |
| 2016 |
21.59% |
| 2017 |
12.64% |
| 2018 |
0.06% |
| 2019 |
32.56% |
| 2020 |
13.20% |
| 2021 |
25.57% |
| 2022 |
-13.42% |
| 2023 |
19.70% |
| 2024 |
7.58% |
| 2025 |
1.92% |
|
| Bar Chart Closing [Text Block] |
Best
Quarter (2Q’20):
19.20%
Worst Quarter (1Q’20):
-23.41%
|
| Highest Quarterly Return, Label [Optional Text] |
Best
Quarter
|
| Highest Quarterly Return |
19.20%
|
| Highest Quarterly Return, Date |
Jun. 30, 2020
|
| Lowest Quarterly Return, Label [Optional Text] |
Worst Quarter
|
| Lowest Quarterly Return |
(23.41%)
|
| Lowest Quarterly Return, Date |
Mar. 31, 2020
|
| Performance Table Heading |
AVERAGE TOTAL ANNUAL RETURN
(for the periods ended December 31, 2025)
|
| Performance Table Uses Highest Federal Rate |
The after-tax returns shown in the table are calculated using the historical highest individual federal marginal income tax rates, and do not reflect the impact of state and local taxes.
|
| Performance Table Not Relevant to Tax Deferred |
Actual after-tax returns depend on the investor’s tax situation and may differ from those shown. The after-tax returns are not relevant to investors who hold their Fund shares through tax-deferred arrangements such as 401(k) plans or individual retirement accounts, or to investors who are tax exempt.
|
| Performance [Table] |
| | |
| |
| |
|
AVERAGE TOTAL ANNUAL RETURN
(for the periods ended December 31, 2025) | |
Investor Shares |
| | |
1 YEAR | |
5 YEARS | |
10 YEARS |
| Return before taxes | |
1.92% | |
7.37% | |
11.37% |
| Return after taxes on distributions | |
1.05% | |
6.85% | |
10.63% |
| Return after taxes on distributions
and sale of fund shares | |
1.77% | |
5.77% | |
9.22% |
| S&P 500® Index* | |
17.88% | |
14.42% | |
14.82% |
| Russell MidCap® Index* | |
10.60% | |
8.67% | |
11.01% |
| * | In
connection with applicable mutual performance disclosure requirements, the Fund has adopted
the use of the S&P 500® Index as its primary comparative benchmark performance
index and it has adopted the use of the Russell Midcap® Index as an additional
comparative benchmark performance index. The Russell Midcap® Index generally
reflects the market sectors in which the Fund primarily invests and the S&P 500®
Index is a broad-based securities markets index that is generally representative of
the overall domestic US equity markets as a whole. |
|
| Performance Table One Class of after Tax Shown [Text] |
After-tax returns are shown for the Investor Class and after-tax returns for other classes will vary.
|
| Performance Table Closing [Text Block] |
The after-tax returns shown in the table are calculated using the historical highest individual federal marginal income tax rates, and do not reflect the impact of state and local taxes. Actual after-tax returns depend on the investor’s tax situation and may differ from those shown. The after-tax returns are not relevant to investors who hold their Fund shares through tax-deferred arrangements such as 401(k) plans or individual retirement accounts, or to investors who are tax exempt. After-tax returns are shown for the Investor Class and after-tax returns for other classes will vary.
|
| Performance Availability Website Address [Text] |
fenimoreasset.com
|
| Investor Shares | FAM Small Cap Fund |
|
| Prospectus [Line Items] |
|
| Bar Chart and Performance Table [Heading] |
Annual
Total Return
|
| Performance Narrative [Text Block] |
The
following bar chart and table show some indication of the risks of investing in the Fund. The bar chart shows changes in the
Investor Shares performance since 2016. The table shows the Investor Shares average annual returns (before and after taxes) for the
1 year, 5-year and 10-year periods ended December 31, 2025 and compared to those of the S&P 500® Index, the Fund’s
primary benchmark as well as those of the Russell 2000® Index, which is an additional benchmark index that the Fund uses for
comparative performance purposes. The
Fund’s past performance (before and after taxes) is not necessarily an indication of how the Fund will perform in the
future. Updated performance information may be obtained at the Fund’s website fenimoreasset.com.
|
| Performance Past Does Not Indicate Future [Text] |
The
Fund’s past performance (before and after taxes) is not necessarily an indication of how the Fund will perform in the
future.
|
| Performance Information Illustrates Variability of Returns [Text] |
The
following bar chart and table show some indication of the risks of investing in the Fund. The bar chart shows changes in the
Investor Shares performance since 2016. The table shows the Investor Shares average annual returns (before and after taxes) for the
1 year, 5-year and 10-year periods ended December 31, 2025 and compared to those of the S&P 500® Index, the Fund’s
primary benchmark as well as those of the Russell 2000® Index, which is an additional benchmark index that the Fund uses for
comparative performance purposes.
|
| Bar Chart [Heading] |
FAM SMALL CAP FUND Investor Shares
|
| Bar Chart [Table] |
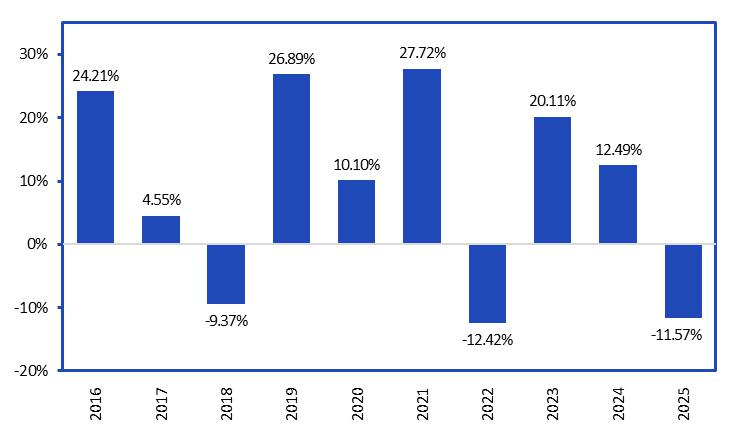
| Years |
Returns |
| 2016 |
24.21% |
| 2017 |
4.55% |
| 2018 |
-9.37% |
| 2019 |
26.89% |
| 2020 |
10.10% |
| 2021 |
27.72% |
| 2022 |
-12.42% |
| 2023 |
20.11% |
| 2024 |
12.49% |
| 2025 |
-11.57% |
|
| Bar Chart Closing [Text Block] |
Best Quarter (4Q’20):
25.41%
Worst Quarter (1Q’20):
-30.29%
|
| Highest Quarterly Return, Label [Optional Text] |
Best Quarter
|
| Highest Quarterly Return |
25.41%
|
| Highest Quarterly Return, Date |
Dec. 31, 2020
|
| Lowest Quarterly Return, Label [Optional Text] |
Worst Quarter
|
| Lowest Quarterly Return |
(30.29%)
|
| Lowest Quarterly Return, Date |
Mar. 31, 2020
|
| Performance Table Heading |
AVERAGE
TOTAL ANNUAL RETURN
(for the periods ended December 31,
2025)
|
| Performance Table Uses Highest Federal Rate |
The after-tax returns shown in the table are calculated using the historical highest individual federal marginal income tax rates, and do not reflect the impact of state and local taxes.
|
| Performance Table Not Relevant to Tax Deferred |
Actual after-tax returns depend on the investor’s tax situation and may differ from those shown. The after-tax returns are not relevant to investors who hold their Fund shares through tax-deferred arrangements such as 401(k) plans or individual retirement accounts, or to investors who are tax exempt.
|
| Performance [Table] |
| | |
| |
| |
|
AVERAGE
TOTAL ANNUAL RETURN
(for the periods ended December 31,
2025) | |
Investor
Shares |
| | |
1
YEAR | |
5
YEARS | |
10
YEARS |
| Return
before taxes | |
-11.57% | |
5.97% | |
8.19% |
| Return
after taxes on distributions | |
-12.26% | |
4.96% | |
7.29% |
| Return
after taxes on distributions and sale of fund shares | |
-6.35% | |
4.68% | |
6.55% |
| S&P
500® Index* | |
17.88% | |
14.42% | |
14.82% |
| Russell
2000® Index* | |
12.81% | |
6.09% | |
9.62% |
| * |
In
connection with applicable mutual performance disclosure requirements, the Fund has adopted
the use of the S&P 500® Index as its primary comparative benchmark performance
index and it has adopted the use of the Russell 2000® Index as an additional
comparative benchmark performance index. The Russell 2000® Index generally
reflects the market sectors in which the Fund primarily invests and the S&P 500®
Index is a broad-based securities markets index that is generally representative of
the overall domestic US equity markets as a whole. |
|
| Performance Table One Class of after Tax Shown [Text] |
After-tax returns are shown for the Investor Class and after-tax returns for other classes will vary.
|
| Performance Table Closing [Text Block] |
The after-tax returns shown in the table are calculated using the historical highest individual federal marginal income tax rates, and do not reflect the impact of state and local taxes. Actual after-tax returns depend on the investor’s tax situation and may differ from those shown. The after-tax returns are not relevant to investors who hold their Fund shares through tax-deferred arrangements such as 401(k) plans or individual retirement accounts, or to investors who are tax exempt. After-tax returns are shown for the Investor Class and after-tax returns for other classes will vary.
|
| Performance Availability Website Address [Text] |
fenimoreasset.com
|
| Institutional | FAM Value Fund |
|
| Prospectus [Line Items] |
|
| Bar Chart and Performance Table [Heading] |
Annual Total Return
|
| Performance Narrative [Text Block] |
The
performance results shown below for the periods prior to January 3, 2017, the date of commencement of operations of the
Institutional Shares for the Fund, are for a class of shares of the Fund that are not offered in this Prospectus, Investor Shares,
which are subject to higher fees as a result of differences in the shareholder administrative services fees and certain other fees
paid by each class. Institutional Shares and Investor Shares would have substantially similar performance results because the shares
of each class are invested in the same portfolio securities of the Fund. Because of the difference in the level of fees paid by
Investor Shares, the returns for the Investor Shares will be lower than the returns for Institutional Shares. The following bar
chart and table show some indication of the risks of investing in the Fund. The
bar chart and table show the Investor Shares performance for periods prior to January 3, 2017 and Institutional Shares
performance thereafter. The table shows the average annual returns (before and after taxes) for the 1-year, 5-year and 10-year
periods ended December 31, 2025 and compared to those of the S&P 500® Index, the Fund’s primary benchmark index
as well as those of the Russell Midcap® Index, which is an additional benchmark index that the Fund uses for comparative
performance purposes. The
Fund’s past performance (before and after taxes) is not necessarily an indication of how the Fund will perform in the
future. Updated performance information may be obtained at the Fund’s website fenimoreasset.com.
|
| Performance Past Does Not Indicate Future [Text] |
The
Fund’s past performance (before and after taxes) is not necessarily an indication of how the Fund will perform in the
future.
|
| Performance Information Illustrates Variability of Returns [Text] |
The
bar chart and table show the Investor Shares performance for periods prior to January 3, 2017 and Institutional Shares
performance thereafter. The table shows the average annual returns (before and after taxes) for the 1-year, 5-year and 10-year
periods ended December 31, 2025 and compared to those of the S&P 500® Index, the Fund’s primary benchmark index
as well as those of the Russell Midcap® Index, which is an additional benchmark index that the Fund uses for comparative
performance purposes.
|
| Bar Chart [Heading] |
FAM VALUE FUND Institutional Shares
|
| Bar Chart [Table] |
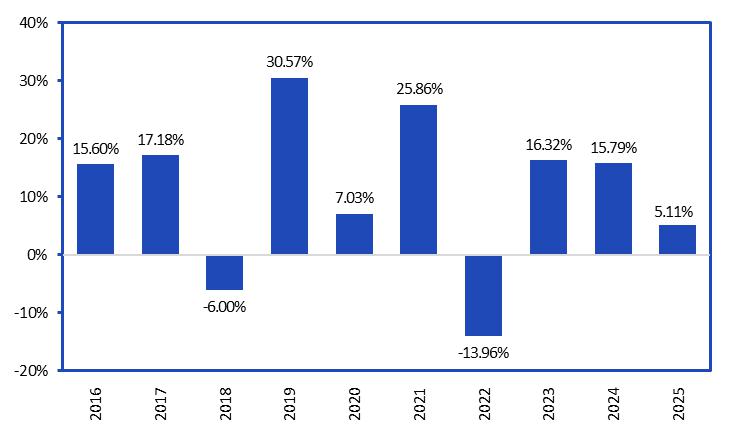
| Years |
Returns |
| 2016 |
15.60% |
| 2017 |
17.18% |
| 2018 |
-6.00% |
| 2019 |
30.57% |
| 2020 |
7.03% |
| 2021 |
25.86% |
| 2022 |
-13.96% |
| 2023 |
16.32% |
| 2024 |
15.79% |
| 2025 |
5.11% |
|
| Bar Chart Closing [Text Block] |
Best
Quarter (2Q’20):
15.82%
Worst Quarter (1Q’20):
-23.69% |
|
| Highest Quarterly Return, Label [Optional Text] |
Best
Quarter
|
| Highest Quarterly Return |
15.82%
|
| Highest Quarterly Return, Date |
Jun. 30, 2020
|
| Lowest Quarterly Return, Label [Optional Text] |
Worst Quarter
|
| Lowest Quarterly Return |
(23.69%)
|
| Lowest Quarterly Return, Date |
Mar. 31, 2020
|
| Performance Table Heading |
AVERAGE
TOTAL ANNUAL RETURN
(for the periods ended December 31, 2025)
|
| Performance Table Uses Highest Federal Rate |
The after-tax returns shown in the table are calculated using the historical highest individual federal marginal income tax rates, and do not reflect the impact of state and local taxes.
|
| Performance Table Not Relevant to Tax Deferred |
Actual after-tax returns depend on the investor’s tax situation and may differ from those shown. The after-tax returns are not relevant to investors who hold their Fund shares through tax-deferred arrangements such as 401(k) plans or individual retirement accounts, or to investors who are tax exempt.
|
| Performance [Table] |
| |
|
|
|
|
|
|
AVERAGE
TOTAL ANNUAL RETURN
(for the periods ended December 31, 2025)
|
|
Institutional
Shares |
| |
|
1
YEAR |
|
5
YEARS |
|
10
YEARS |
| Return
before taxes |
|
5.11% |
|
8.92% |
|
10.56% |
| Return after taxes on distributions |
|
3.97% |
|
7.69% |
|
9.30% |
| Return after taxes on distributions and sale
of fund shares |
|
3.86% |
|
6.93% |
|
8.44% |
| S&P 500® Index* |
|
17.88% |
|
14.42% |
|
14.82% |
| Russell MidCap®
Index* |
|
10.60% |
|
8.67% |
|
11.01% |
| * | In
connection with applicable mutual performance disclosure requirements, the Fund has adopted
the use of the S&P 500® Index as its primary comparative benchmark performance
index and it has adopted the use of the Russell Midcap® Index as an additional
comparative benchmark performance index. The Russell Midcap® Index generally
reflects the market sectors in which the Fund primarily invests and the S&P 500®
Index is a broad-based securities markets index that is generally representative of
the overall domestic US equity markets as a whole. |
|
| Performance Table One Class of after Tax Shown [Text] |
After-tax returns are shown for the Institutional Class and after-tax returns for other classes will vary.
|
| Performance Table Closing [Text Block] |
The after-tax returns shown in the table are calculated using the historical highest individual federal marginal income tax rates, and do not reflect the impact of state and local taxes. Actual after-tax returns depend on the investor’s tax situation and may differ from those shown. The after-tax returns are not relevant to investors who hold their Fund shares through tax-deferred arrangements such as 401(k) plans or individual retirement accounts, or to investors who are tax exempt. After-tax returns are shown for the Institutional Class and after-tax returns for other classes will vary.
|
| Performance Availability Website Address [Text] |
fenimoreasset.com
|
| Institutional | SUMMARY SECTION |
|
| Prospectus [Line Items] |
|
| Bar Chart and Performance Table [Heading] |
Annual Total Return
|
| Performance Narrative [Text Block] |
The
Institutional Shares of the Fund have not yet commenced operations and therefore do not yet have their own performance history. The performance
results shown are for the Investor shares which are not offered in this Prospectus. Investor Shares are subject to higher fees because
of differences in the shareholder administrative services fees and certain other fees paid by each class. Institutional Shares and Investor
Shares would have substantially similar performance results because the shares of each class are invested in the same portfolio securities
of the Fund. Because of the difference in the level of fees paid by Investor Shares, the returns for the Investor Shares will be lower
than the returns for Institutional Shares. The following bar chart and table show some indication of the risks of investing in the Fund.
The bar chart shows changes in the Investor Shares performance since 2016. The table shows the Investor Shares average annual
returns (before and after taxes) for the 1-year, 5-year and 10-year periods ended December 31, 2025 and compared to those of the S&P 500®
Index, the Fund’s primary benchmark index as well as those of the Russell Midcap®
Index, which is an additional benchmark index
that the Fund uses for comparative performance purposes. The Fund’s past performance (before and after taxes) is not necessarily
an indication of how the Fund will perform in the future. Updated performance information may be obtained at the Fund’s website
fenimoreasset.com.
|
| Performance Past Does Not Indicate Future [Text] |
The Fund’s past performance (before and after taxes) is not necessarily
an indication of how the Fund will perform in the future.
|
| Performance Information Illustrates Variability of Returns [Text] |
The bar chart shows changes in the Investor Shares performance since 2016. The table shows the Investor Shares average annual
returns (before and after taxes) for the 1-year, 5-year and 10-year periods ended December 31, 2025 and compared to those of the S&P 500®
Index, the Fund’s primary benchmark index as well as those of the Russell Midcap®
Index, which is an additional benchmark index
that the Fund uses for comparative performance purposes.
|
| Bar Chart [Heading] |
FAM DIVIDEND FOCUS FUND Investor Shares
|
| Bar Chart [Table] |
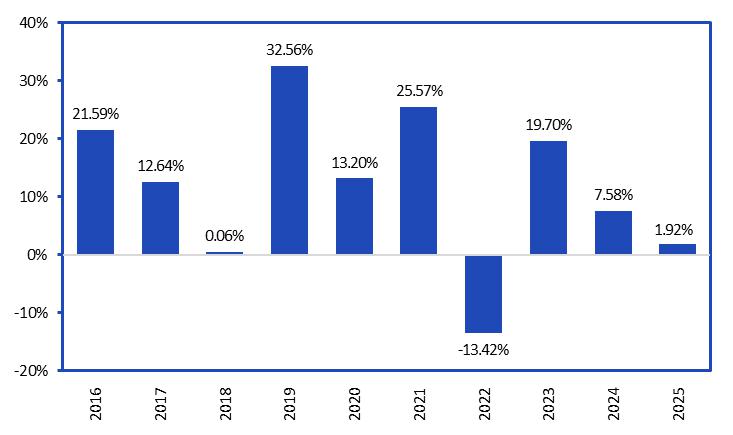
| Years |
Returns |
| 2016 |
21.59% |
| 2017 |
12.64% |
| 2018 |
0.06% |
| 2019 |
32.56% |
| 2020 |
13.20% |
| 2021 |
25.57% |
| 2022 |
-13.42% |
| 2023 |
19.70% |
| 2024 |
7.58% |
| 2025 |
1.92% |
|
| Bar Chart Closing [Text Block] |
Best
Quarter (2Q’20):
19.20%
Worst Quarter (1Q’20):
-23.41% |
|
| Highest Quarterly Return, Label [Optional Text] |
Best
Quarter
|
| Highest Quarterly Return |
19.20%
|
| Highest Quarterly Return, Date |
Jun. 30, 2020
|
| Lowest Quarterly Return, Label [Optional Text] |
Worst Quarter
|
| Lowest Quarterly Return |
(23.41%)
|
| Lowest Quarterly Return, Date |
Mar. 31, 2020
|
| Performance Table Heading |
AVERAGE
TOTAL ANNUAL RETURN
(for the periods ended December 31, 2025)
|
| Performance Table Uses Highest Federal Rate |
The after-tax returns shown in the table are calculated using the historical highest individual federal marginal income tax rates, and do not reflect the impact of state and local taxes.
|
| Performance Table Not Relevant to Tax Deferred |
Actual after-tax returns depend on the investor’s tax situation and may differ from those shown. The after-tax returns are not relevant to investors who hold their Fund shares through tax-deferred arrangements such as 401(k) plans or individual retirement accounts, or to investors who are tax exempt.
|
| Performance [Table] |
| |
|
|
|
|
|
|
AVERAGE
TOTAL ANNUAL RETURN
(for the periods ended December 31, 2025)
|
|
Investor
Shares |
| |
|
1
YEAR |
|
5
YEARS |
|
10
YEARS |
| Return
before taxes |
|
1.92% |
|
7.37% |
|
11.37% |
| Return after taxes on distributions |
|
1.05% |
|
6.85% |
|
10.63% |
| Return after taxes on distributions and sale
of fund shares |
|
1.77% |
|
5.77% |
|
9.22% |
| S&P 500® Index* |
|
17.88% |
|
14.42% |
|
14.82% |
| Russell MidCap® Index* |
|
10.60% |
|
8.67% |
|
11.01% |
| * |
In
connection with applicable mutual performance disclosure requirements, the Fund has adopted the use of the S&P 500®
Index as its primary comparative benchmark performance index and it has adopted the use of the Russell Midcap®
Index as an additional comparative benchmark performance index. The Russell Midcap® Index generally reflects
the market sectors in which the Fund primarily invests and the S&P 500® Index is a broad-based securities
markets index that is generally representative of the overall domestic US equity markets as a whole. |
|
| Performance Table One Class of after Tax Shown [Text] |
After-tax returns are shown for the Investor Class and after-tax returns for other classes will vary.
|
| Performance Table Closing [Text Block] |
The after-tax returns shown in the table are calculated using the historical highest individual federal marginal income tax rates, and do not reflect the impact of state and local taxes. Actual after-tax returns depend on the investor’s tax situation and may differ from those shown. The after-tax returns are not relevant to investors who hold their Fund shares through tax-deferred arrangements such as 401(k) plans or individual retirement accounts, or to investors who are tax exempt. After-tax returns are shown for the Investor Class and after-tax returns for other classes will vary.
|
| Performance Availability Website Address [Text] |
fenimoreasset.com
|
| Institutional | FAM Small Cap Fund |
|
| Prospectus [Line Items] |
|
| Bar Chart and Performance Table [Heading] |
Annual Total Return
|
| Performance Narrative [Text Block] |
The
following bar chart and table show some indication of the risks of investing in the Fund. The
bar chart shows changes in the
Institutional Shares performance since 2016. The table shows the Institutional Shares average annual returns (before and after
taxes) for the 1-year, 5-year and 10-year periods ended December 31, 2025 and compared to those of the S&P
500® Index, the Fund’s primary benchmark index as well as those of the Russell 2000® Index,
which is an additional benchmark index that the Fund uses for comparative performance purposes. The
Fund’s past performance (before and after taxes) is not necessarily an indication of how the Fund will perform in the
future. Updated performance
information may be obtained at the Fund’s website fenimoreasset.com.
|
| Performance Past Does Not Indicate Future [Text] |
The
Fund’s past performance (before and after taxes) is not necessarily an indication of how the Fund will perform in the
future.
|
| Performance Information Illustrates Variability of Returns [Text] |
The
bar chart shows changes in the
Institutional Shares performance since 2016. The table shows the Institutional Shares average annual returns (before and after
taxes) for the 1-year, 5-year and 10-year periods ended December 31, 2025 and compared to those of the S&P
500® Index, the Fund’s primary benchmark index as well as those of the Russell 2000® Index,
which is an additional benchmark index that the Fund uses for comparative performance purposes.
|
| Bar Chart [Heading] |
FAM SMALL CAP FUND Institutional Shares
|
| Bar Chart [Table] |
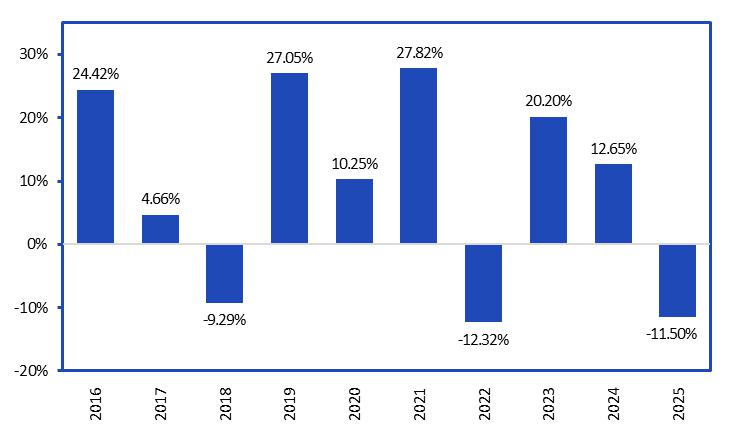
| Years |
Returns |
| 2016 |
24.42% |
| 2017 |
4.66% |
| 2018 |
-9.29% |
| 2019 |
27.05% |
| 2020 |
10.25% |
| 2021 |
27.82% |
| 2022 |
-12.32% |
| 2023 |
20.20% |
| 2024 |
12.65% |
| 2025 |
-11.50% |
|
| Bar Chart Closing [Text Block] |
Best
Quarter (4Q’20):
25.49%
Worst Quarter (1Q’20)
-30.28% |
|
| Highest Quarterly Return, Label [Optional Text] |
Best
Quarter
|
| Highest Quarterly Return |
25.49%
|
| Highest Quarterly Return, Date |
Dec. 31, 2020
|
| Lowest Quarterly Return, Label [Optional Text] |
Worst Quarter
|
| Lowest Quarterly Return |
(30.28%)
|
| Lowest Quarterly Return, Date |
Mar. 31, 2020
|
| Performance Table Heading |
AVERAGE
TOTAL ANNUAL RETURN
(for the periods ended December 31, 2025)
|
| Performance Table Uses Highest Federal Rate |
The after-tax returns shown in the table are calculated using the historical highest individual federal marginal income tax rates, and do not reflect the impact of state and local taxes.
|
| Performance Table Not Relevant to Tax Deferred |
Actual after-tax returns depend on the investor’s tax situation and may differ from those shown. The after-tax returns are not relevant to investors who hold their Fund shares through tax-deferred arrangements such as 401(k) plans or individual retirement accounts, or to investors who are tax exempt.
|
| Performance [Table] |
| |
|
|
|
|
|
|
AVERAGE
TOTAL ANNUAL RETURN
(for the periods ended December 31, 2025)
|
|
Institutional
Shares |
| |
|
1
YEAR |
|
5
YEARS |
|
10
YEARS |
| Return
before taxes |
|
-11.50% |
|
6.07% |
|
8.31% |
| Return after taxes on distributions |
|
-12.18% |
|
5.07% |
|
7.41% |
| Return after taxes on distributions and sale
of fund shares |
|
-6.31% |
|
4.76% |
|
6.65% |
| S&P 500 Index |
|
17.88% |
|
14.42% |
|
14.82% |
| Russell 2000® Index |
|
12.81% |
|
6.09% |
|
9.62% |
| * |
In connection
with applicable mutual performance disclosure requirements, the Fund has adopted the use of the S&P 500® Index
as its primary comparative benchmark performance index and it has adopted the use of the Russell 2000® Index as an
additional comparative benchmark performance index. The Russell 2000® Index generally reflects the market sectors
in which the Fund primarily invests and the S&P 500® Index is a broad-based securities markets index that is
generally representative of the overall domestic US equity markets as a whole. |
|
| Performance Table One Class of after Tax Shown [Text] |
After-tax returns are shown for the Institutional Class and after-tax returns for other classes will vary.
|
| Performance Table Closing [Text Block] |
The after-tax returns shown in the table are calculated using the historical highest individual federal marginal income tax rates, and do not reflect the impact of state and local taxes. Actual after-tax returns depend on the investor’s tax situation and may differ from those shown. The after-tax returns are not relevant to investors who hold their Fund shares through tax-deferred arrangements such as 401(k) plans or individual retirement accounts, or to investors who are tax exempt. After-tax returns are shown for the Institutional Class and after-tax returns for other classes will vary.
|
| Performance Availability Website Address [Text] |
fenimoreasset.com
|