The bar chart and performance table below show the variability of the Fund’s returns over time, which is some indication of the risks of investing in the Fund. The bar chart shows performance of the Shares for each full calendar year since the Fund’s inception. The performance table compares the performance of the Shares over time to the performance of a broad-based market index and a secondary index. You should be aware that the Fund’s past performance (before and after taxes) may not be an indication of how the Fund will perform in the future. Updated performance information is available at no cost by visiting www.neosfunds.com or by calling 833-833-1311.
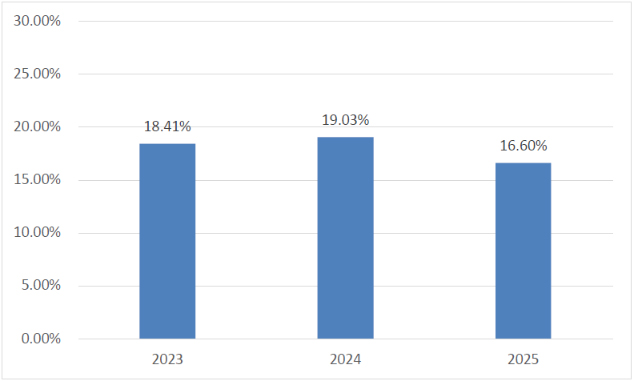
| Best Quarter: | 6/30/2025 | 8.47% | ||
| Worst Quarter: | 3/31/2025 | -2.85% |
| One-Year | Since Inception (8/30/2022) | |
| Return Before Taxes | 16.60% | 14.72% |
| Return After Taxes on Distributions (No Load) | 16.43% | 14.16% |
| Return After Taxes on Distributions and Sale of Fund Shares (No Load) | 9.93% | 11.38% |
| Cboe S&P 500® BuyWrite Monthly Index – BXM* | 8.91% | 11.43% |
| S&P 500® Total Return Index** | 17.88% | 18.92% |
| * | The CBOE S&P 500® BuyWrite Monthly Index – BXM is designed to show the hypothetical performance of a portfolio that engages in a buy-write strategy using S&P 500® index call options. Index returns assume reinvestment of dividends. Investors may not invest in the Index directly. Unlike the Fund’s returns, the index does not reflect any fees or expenses. |
| ** | The S&P 500® Total Return Index is a free-float market capitalization-weighted index of 500 of the largest U.S. companies. Index returns assume reinvestment of dividends. Investors may not invest in the Index directly. Unlike the Fund’s returns, the Index does not reflect any fees or expenses. |
After-tax returns were calculated using the historical highest individual federal marginal income tax rates and do not reflect the impact of state and local taxes. Actual after-tax returns depend on an investor’s tax situation and may differ from those shown, and after-tax returns shown are not relevant to investors who hold shares of the Fund through tax-deferred arrangements, such as 401(k) plans or individual retirement accounts.
The bar chart and performance table below show the variability of the Fund’s returns over time, which is some indication of the risks of investing in the Fund. The bar chart shows performance of the Shares for each full calendar year since the Fund’s inception. The performance table compares the performance of the Shares over time to the performance of a broad-based market index. You should be aware that the Fund’s past performance (before and after taxes) may not be an indication of how the Fund will perform in the future. Updated performance information is available at no cost by visiting www.neosfunds.com or by calling 833-833-1311.
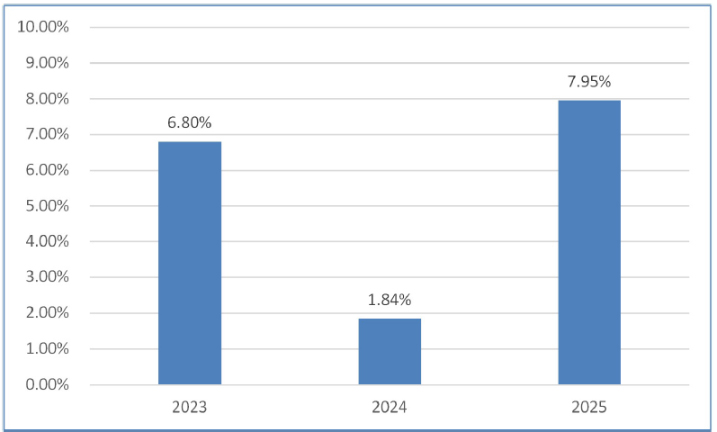
| Best Quarter: | 12/31/2023 | 6.91% | ||
| Worst Quarter: | 9/30/2023 | -3.20% |
| One-Year | Since Inception (8/30/2022) | |
| Return Before Taxes | 7.95% | 4.12% |
| Return After Taxes on Distributions (No Load) | 6.12% | 2.44% |
| Return After Taxes on Distributions and Sale of Fund Shares (No Load) | 4.82% | 2.47% |
| Bloomberg US Aggregate Bond Index* | 7.30% | 3.27% |
| * | The Bloomberg U.S. Aggregate Bond Index is an unmanaged index comprised of U.S. investment grade, fixed rate bond market securities, including government, government agency, corporate and mortgage-backed securities between one and ten years. Index returns assume reinvestment of dividends. Investors may not invest in the Index directly. Unlike the Fund’s returns, the index does not reflect any fees or expenses. |
After-tax returns were calculated using the historical highest individual federal marginal income tax rates and do not reflect the impact of state and local taxes. Actual after-tax returns depend on an investor’s tax situation and may differ from those shown, and after-tax returns shown are not relevant to investors who hold shares of the Fund through tax-deferred arrangements, such as 401(k) plans or individual retirement accounts.
The bar chart and performance table below show the variability of the Fund’s returns over time, which is some indication of the risks of investing in the Fund. The bar chart shows performance of the Shares for each full calendar year since the Fund’s inception. The performance table compares the performance of the Shares over time to the performance of a broad-based market index and a secondary index. You should be aware that the Fund’s past performance (before and after taxes) may not be an indication of how the Fund will perform in the future. Updated performance information is available at no cost by visiting www.neosfunds.com or by calling 833-833-1311.
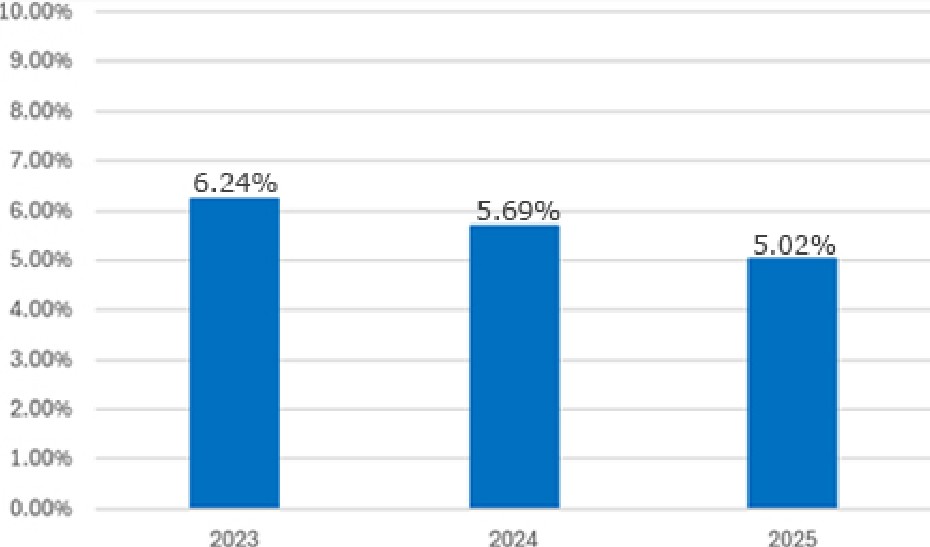
| Best Quarter: | 3/31/2023 | 1.72% | ||
| Worst Quarter: | 3/31/2025 | 0.98% |
| One-Year | Since
Inception (8/30/2022) | |
| Return Before Taxes | 5.02% | 5.51% |
| Return After Taxes on Distributions (No Load) | 3.11% | 3.37% |
| Return After Taxes on Distributions and Sale of Fund Shares (No Load) | 3.06% | 3.33% |
| Bloomberg US Aggregate Bond Index* | 7.30% | 3.27% |
| Bloomberg 1-3 Month US Treasury Bill Index** | 4.29% | 4.75% |
| * | The Bloomberg U.S. Aggregate Bond Index is an unmanaged index comprised of U.S. investment grade, fixed rate bond market securities, including government, government agency, corporate and mortgage-backed securities between one and ten years. Index returns assume reinvestment of dividends. Investors may not invest in the Index directly. Unlike the Fund’s returns, the index does not reflect any fees or expenses. |
| ** | The Bloomberg 1-3 Month US Treasury Bill Index is designed to measure the performance of public obligations of the U.S. Treasury that have a remaining maturity of greater than or equal to 1 month and less than 3 months, and includes all publicly issued U.S. Treasury Bills that have a remaining maturity of less than 3 months and at least 1 month and that are rated investment-grade. Index returns assume reinvestment of dividends. Investors may not invest in the Index directly. Unlike the Fund’s returns, the index does not reflect any fees or expenses. |
After-tax returns were calculated using the historical highest individual federal marginal income tax rates and do not reflect the impact of state and local taxes. Actual after-tax returns depend on an investor’s tax situation and may differ from those shown, and after-tax returns shown are not relevant to investors who hold shares of the Fund through tax-deferred arrangements, such as 401(k) plans or individual retirement accounts.
The bar chart and performance table below show the variability of the Fund’s returns over time, which is some indication of the risks of investing in the Fund. The bar chart shows performance of the Shares for each full calendar year since the Fund’s inception. The performance table compares the performance of the Shares over time to the performance of a broad-based market index. You should be aware that the Fund’s past performance (before and after taxes) may not be an indication of how the Fund will perform in the future. Updated performance information is available at no cost by visiting www.neosfunds.com or by calling 833-833-1311.
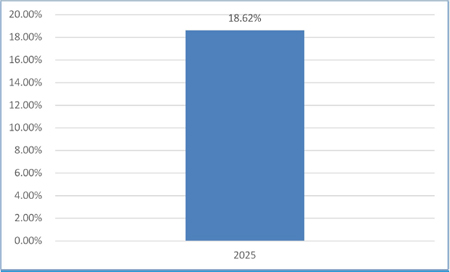
| Best Quarter: | 6/30/2025 | 13.72% | ||
| Worst Quarter: | 3/31/2025 | -6.14% |
| One-Year | Since Inception (1/30/2024) | |
| Return Before Taxes | 18.62% | 19.84% |
| Return After Taxes on Distributions (No Load) | 18.59% | 19.75% |
| Return After Taxes on Distributions and Sale of Fund Shares (No Load) | 11.04% | 15.25% |
| Cboe Nasdaq-100 BuyWrite Index | 7.87% | 14.65% |
| Nasdaq Composite Total Return Index* | 21.14% | 23.79% |
| Nasdaq 100® Total Return Index* | 21.02% | 21.59% |
| * | Investors may not invest in the index directly. Unlike the Fund’s returns, the index does not reflect any fees or expenses. |
After-tax returns were calculated using the historical highest individual federal marginal income tax rates and do not reflect the impact of state and local taxes. Actual after-tax returns depend on an investor’s tax situation and may differ from those shown, and after-tax returns shown are not relevant to investors who hold shares of the Fund through tax-deferred arrangements, such as 401(k) plans or individual retirement accounts.
The bar chart and performance table below show the variability of the Fund’s returns over time, which is some indication of the risks of investing in the Fund. The bar chart shows performance of the Shares for each full calendar year since the Fund’s inception. The performance table compares the performance of the Shares over time to the performance of a broad-based market index. You should be aware that the Fund’s past performance (before and after taxes) may not be an indication of how the Fund will perform in the future. Updated performance information is available at no cost by visiting www.neosfunds.com or by calling 833-833-1311.
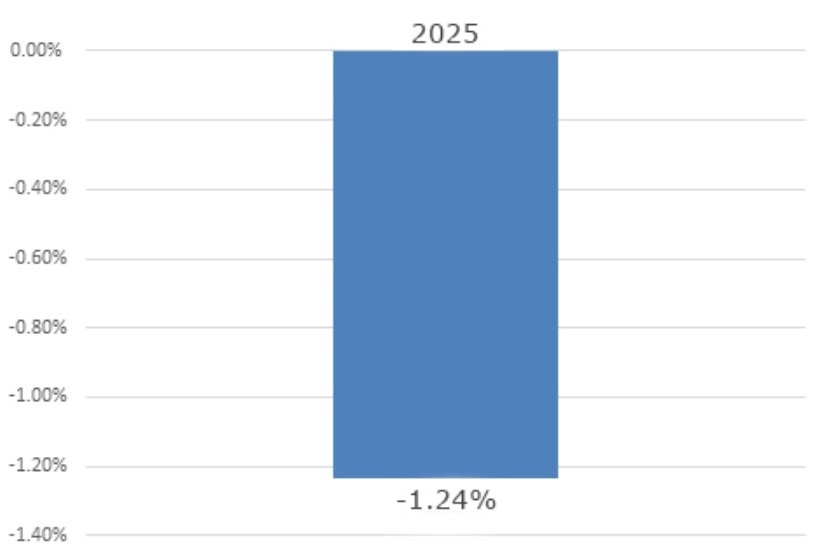
| Best Quarter: | 6/30/2025 | 27.83% | ||
| Worst Quarter: | 12/31/2025 | -20.67% |
| One-Year | Since Inception (10/17/2024) | |
| Return Before Taxes | -1.24% | 20.55% |
| Return After Taxes on Distributions (No Load) | -5.12% | 13.94% |
| Return After Taxes on Distributions and Sale of Fund Shares (No Load) | -0.37% | 13.12% |
| S&P 500 Total Return Index* | 17.88% | 15.48% |
| CME CF BTC-USD Reference Rate 4PM NY** | -6.84% |
23.29% |
| * | The S&P 500® Total Return Index is a free-float market capitalization-weighted index of 500 of the largest U.S. companies. Index returns assume reinvestment of dividends. Investors may not invest in the Index directly. Unlike the Fund’s returns, the index does not reflect any fees or expenses. |
| ** | CME CF BTC-USD Reference Rate 4PM NY is a daily benchmark index price for Bitcoin, published at 4:00 p.m. NY time, that is determined by aggregating Bitcoin-USD trade flow from major cryptocurrency exchanges that conform to the CME CF Constituent Exchange Criteria. Investors may not invest in the Index directly. Unlike the Fund’s returns, the index does not reflect any fees or expenses. |
After-tax returns were calculated using the historical highest individual federal marginal income tax rates and do not reflect the impact of state and local taxes. Actual after-tax returns depend on an investor’s tax situation and may differ from those shown, and after-tax returns shown are not relevant to investors who hold shares of the Fund through tax-deferred arrangements, such as 401(k) plans or individual retirement accounts.
The bar chart and performance table below show the variability of the Fund’s returns over time, which is some indication of the risks of investing in the Fund. The bar chart shows performance of the Shares for each full calendar year since the Fund’s inception. The performance table compares the performance of the Shares over time to the performance of a broad-based market index. You should be aware that the Fund’s past performance (before and after taxes) may not be an indication of how the Fund will perform in the future. Updated performance information is available at no cost by visiting www.neosfunds.com or by calling 833-833-1311.
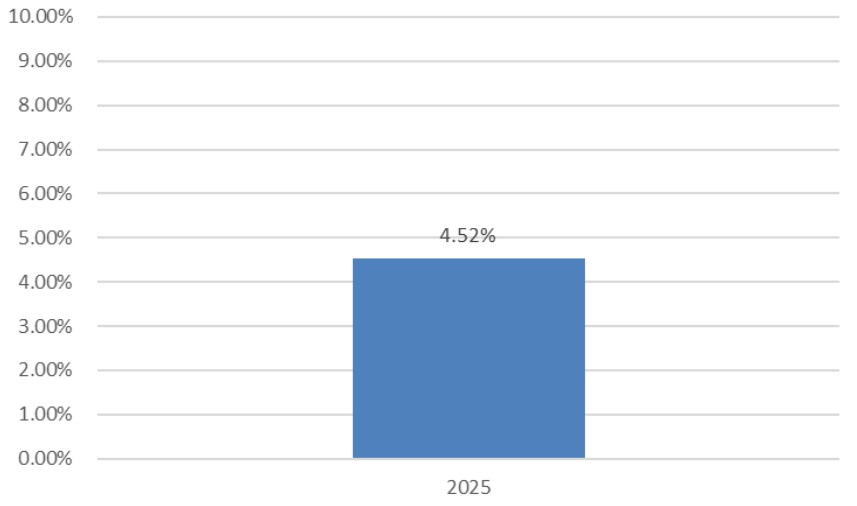
| Best Quarter: | 3/31/2025 | 4.12% | ||
| Worst Quarter: | 6/30/2025 | -1.53% |
| One-Year | Since
Inception (12/11/2024) | |
| Return Before Taxes | 4.52% | -1.28% |
| Return After Taxes on Distributions (No Load) | 2.54% | -3.26% |
| Return After Taxes on Distributions and Sale of Fund Shares (No Load) | 2.73% | -1.77% |
| Bloomberg U.S. Aggregate Bond Index* | 7.30% | 5.16% |
| ICE US Treasury 20+ Year Bond Total Return Index** | 4.29% | -1.54% |
| * | The Bloomberg U.S. Aggregate Bond Index is an unmanaged index comprised of U.S. investment grade, fixed rate bond market securities, including government, government agency, corporate and mortgage-backed securities between one and ten years. Index returns assume reinvestment of dividends. Investors may not invest in the Index directly. Unlike the Fund’s returns, the iIndex does not reflect any fees or expenses. |
| ** | The ICE US Treasury 20+ Year Bond Total Return Index measures US dollar-denominated, fixed-rate, nominal debt issued by the US Treasury with 20+ years to maturity. Index returns assume reinvestment of dividends. Investors may not invest in the Index directly. Unlike the Fund’s returns, the index does not reflect any fees or expenses. |
After-tax returns were calculated using the historical highest individual federal marginal income tax rates and do not reflect the impact of state and local taxes. Actual after-tax returns depend on an investor’s tax situation and may differ from those shown, and after-tax returns shown are not relevant to investors who hold shares of the Fund through tax-deferred arrangements, such as 401(k) plans or individual retirement accounts.
The Fund acquired all of the assets and liabilities of the WSTCM Credit Select Risk-Managed Fund, a series of the WST Investment Trust (the “Predecessor Fund”), in tax-free reorganization on September 27, 2024. The Fund adopted the financial statements of the Predecessor Fund, the accounting survivor of the Reorganization. Performance results shown in the bar chart and the performance table below reflect the performance of the Predecessor Fund prior to September 27, 2024. Note that the Fund is managed by a new investment adviser using substantially the same investment strategy as employed for the Predecessor Fund with the addition of a put option strategy designed to generate additional income. In addition, the Fund is an exchange-traded fund, while the Predecessor Fund was a mutual fund prior to the Reorganization. The Predecessor Fund’s investment objective was modified to additionally seek tax efficient monthly income.
The bar chart and table that follow provide some indication of the risks of investing in the Fund by showing changes in the Predecessor Fund’s performance from year to year and by showing how the Fund’s and Predecessor Fund’s average annual total returns for one year, five years, and since inception compare with those of a broad-based securities market index and a supplemental index. The bar chart and table show the performance of the Predecessor Fund’s Institutional Shares. How the Predecessor Fund and the Fund have performed in the past (before and after taxes) is not necessarily an indication of how the Fund will perform in the future. Updated performance information is also available on the Fund’s website at www.neosfunds.com.
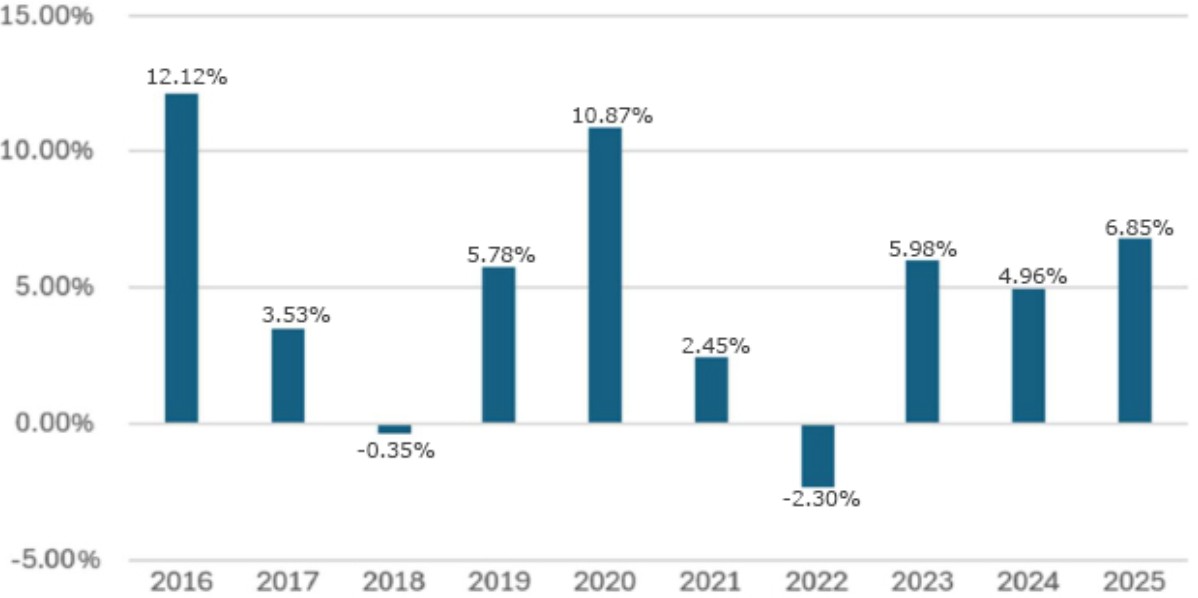
| Best Quarter | 12/31/2023 | 5.07% | ||
| Worst Quarter | 3/31/2022 | -1.59% |
| One Year | Five Years | Ten Years | Since
Inception (September 30, 2014) | |
| Return Before Taxes | 6.85% | 3.53% | 4.90% | 4.18% |
| Return After Taxes on Distributions | 4.22% | 1.73% | 3.14% | 2.56% |
| Return After Taxes on Distributions and Sale of Fund Shares | 4.00% | 1.92% | 3.01% | 2.50% |
| Bloomberg U.S. Aggregate Bond Index(1) | 7.30% | -0.36% | 2.01% | 1.99% |
| Bloomberg U.S. Corporate High Yield Bond Index(2) | 8.62% | 4.51% | 6.53% | 5.26% |
| (1) | The Bloomberg U.S. Aggregate Bond Index is an unmanaged index comprised of U.S. investment grade, fixed rate bond market securities, including government, government agency, corporate and mortgage-backed securities between one and ten years. Index returns assume reinvestment of dividends. Investors may not invest in the Index directly. Unlike the Fund’s returns, the index does not reflect any fees or expenses. |
| (2) | The Bloomberg U.S. Corporate High Yield Bond Index is a broad-based unmanaged index that is generally considered to be representative of the performance of fixed-rate, non-investment-grade debt. Index returns assume reinvestment of dividends. Investors may not invest in the Index directly. Unlike the Fund’s returns, the index does not reflect any fees or expenses. |
After-tax returns are calculated using the historical highest individual federal marginal income tax rates and do not reflect the impact of state and local taxes. Actual after-tax returns depend on an investor’s tax situation and may differ from those shown and are not relevant to investors who hold their Fund shares through tax-deferred arrangements, such as 401(k) plans or individual retirement accounts (“IRAs”).
The Fund acquired the assets and liabilities of the Nationwide Nasdaq-100® Risk-Managed Income ETF, a series of the ETF Series Solutions (the “Predecessor Fund”) on November 8, 2024. The Fund adopted the financial statements of the Predecessor Fund, the accounting successor of the Reorganization. Performance results shown in the bar chart and the performance table below reflect the performance of the Predecessor Fund for periods prior to November 8, 2024. Note that while the investment strategy of the Fund and the Predecessor Fund both include an options strategy designed to reduce volatility and provide a measure of downside protection, the options strategy employed for the Fund has been modified.
The following performance information indicates some of the risks of investing in the Fund. The bar chart shows the Fund’s performance for the calendar years ended December 31. The table illustrates how the Fund’s average annual returns over various periods compared with those of a broad measure of market performance as well as an additional index that represents the asset classes in which the Fund invests. The Fund’s past performance, before and after taxes, does not necessarily indicate how it will perform in the future. Updated performance information is also available on the Fund’s website at www.neosfunds.com.
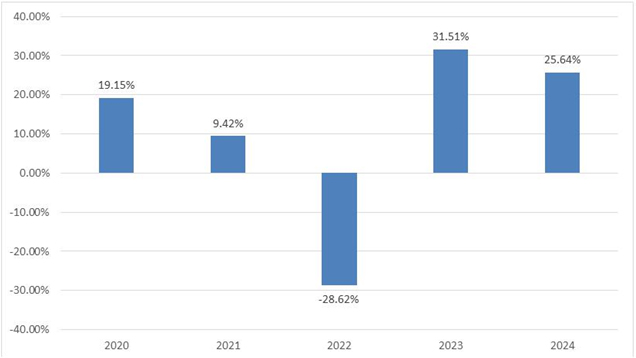
| Best Quarter | 06/30/2020 | 16.13% | ||
| Worst Quarter | 06/30/2022 | -20.14% |
| 1 Year | 5 Years | Since Inception (12/19/19) | |
| Return Before Taxes | 13.78% | 8.10% | 9.91% |
| Return After Taxes on Distributions (No load) | 13.76% | 8.06% | 9.84% |
| Return After Taxes on Distributions and Sale of Shares (No load) | 8.17% | 6.35% | 7.89% |
Cboe S&P 500 Zero-Cost Put Spread Collar Index (reflects no deduction for fees, expenses, or taxes) |
13.65% | 11.39% | 10.94% |
| Nasdaq 100® Total Return Index | 21.02% | 15.30% | 20.41% |
Nasdaq® Composite Total Return Index (reflects no deduction for fees, expenses, or taxes) |
21.14% | 13.35% | 18.18% |
After-tax returns are calculated using the historical highest individual federal marginal income tax rates during the period covered by the table above and do not reflect the impact of state and local taxes. Actual after-tax returns depend on an investor’s tax situation and may differ from those shown. After-tax returns shown are not relevant to investors who hold their Shares through tax-deferred arrangements such as an individual retirement account (“IRA”) or other tax-advantaged accounts.
The Fund has not completed a full calendar year of operations and therefore, no performance information is presented for the Fund at this time. In the future, performance information will be presented in this section of this Prospectus. Updated performance information will be available at no cost by visiting the Fund’s website at www.neosfunds.com.
The bar chart and performance table below show the variability of the Fund’s returns over time, which is some indication of the risks of investing in the Fund. The bar chart shows performance of the Shares for each full calendar year since the Fund’s inception. The performance table compares the performance of the Shares over time to the performance of a broad-based market index. You should be aware that the Fund’s past performance (before and after taxes) may not be an indication of how the Fund will perform in the future. Updated performance information is available at no cost by visiting www.neosfunds.com or by calling 833-833-1311.
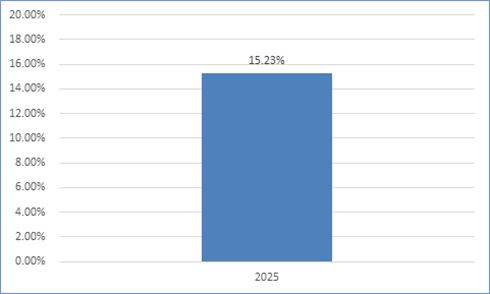
| Best Quarter: | 9/30/2025 | 11.00% | ||
| Worst Quarter: | 3/31/2025 | -7.11% |
| One-Year | Since
Inception (06/25/2024) | |
| Return Before Taxes | 15.23% | 14.31% |
| Return After Taxes on Distributions (No Load) | 14.18% | 13.17% |
| Return After Taxes on Distributions and Sale of Fund Shares (No Load) | 9.41% | 10.58% |
| S&P 500 Total Return Index* | 17.88% | 17.71% |
| Russell 2000® Total Return Index** | 12.81% | 15.67% |
| * | The S&P 500® Total Return Index is a free-float market capitalization-weighted index of 500 of the largest U.S. companies. Index returns assume reinvestment of dividends. Investors may not invest in the index directly. Unlike the Fund’s returns, the index does not reflect any fees or expenses. |
| ** | The Russell 2000® Index is a market capitalization index comprised of securities of approximately 2,000 leading U.S.-listed companies. The Russell 2000® Index measures the performance of the small-cap segment of the US equity universe. The Russell 2000® Index is a subset of the Russell 3000® Index, which is designed to represent approximately 98% of the investable US equity market. The Russell 2000® Index includes approximately 2,000 of the smallest securities based on a combination of their market cap and current index membership. Index returns assume reinvestment of dividends. Investors may not invest in the Index directly. Unlike the Fund’s returns, the index does not reflect any fees or expenses. |
After-tax returns were calculated using the historical highest individual federal marginal income tax rates and do not reflect the impact of state and local taxes. Actual after-tax returns depend on an investor’s tax situation and may differ from those shown, and after-tax returns shown are not relevant to investors who hold shares of the Fund through tax-deferred arrangements, such as 401(k) plans or individual retirement accounts.
The Fund has not completed a full calendar year of operations and therefore, no performance information is presented for the Fund at this time. In the future, performance information will be presented in this section of this Prospectus. Also, shareholder reports containing financial and performance information will be mailed to shareholders semi-annually. Updated performance information will be available at no cost by visiting the Fund’s website at www.neosfunds.com.
The Fund is new, and therefore, no performance information is presented for the Fund at this time. In the future, performance information will be presented in this section of this Prospectus. Updated performance information will be available at no cost by visiting the Fund’s website at www.Neosfunds.com.
The Fund is new, and therefore, no performance information is presented for the Fund at this time. In the future, performance information will be presented in this section of this Prospectus. Also, shareholder reports containing financial and performance information will be mailed to shareholders semi-annually. Updated performance information will be available at no cost by visiting the Fund’s website at www.neosetfs.com.
The Fund is new, and therefore, no performance information is presented for the Fund at this time. In the future, performance information will be presented in this section of this Prospectus. Updated performance information is available at no cost by visiting the Fund’s website at www.neosfunds.com.
The Fund is new, and therefore, no performance information is presented for the Fund at this time. In the future, performance information will be presented in this section of this Prospectus. Also, shareholder reports containing financial and performance information will be mailed to shareholders semi-annually. Updated performance information will be available at no cost by visiting the Fund’s website at www.Neosfunds.com.
The Fund is new, and therefore, no performance information is presented for the Fund at this time. In the future, performance information will be presented in this section of this Prospectus. Updated performance information will be available at no cost by visiting the Fund’s website at www.neosfunds.com.