v3.26.1
Performance Management
Dec. 31, 2025
(MSIF - Counterpoint Global Portfolios) | Advantage Portfolio  
Prospectus [Line Items]  
Bar Chart and Performance Table [Heading] Performance Information
Performance Narrative [Text Block]
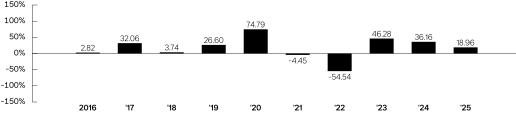
The bar chart and table below provide some indication of the risks of investing in the Fund by showing changes in the Fund’s Class I shares’ performance from year-to-year and by showing how the Fund’s average annual returns for the past one, five and ten year periods and since inception compare with those of a broad measure of market performance and one or more additional indexes. The additional index(es) in the table provides a means to compare the Fund’s average annual total returns to a benchmark that the Adviser believes is representative of the Fund’s investment universe. The performance of the other classes, which is shown in the table below, will differ because the classes have different ongoing fees. The Fund’s returns in the table include the maximum applicable sales charge for Class A and Class C and assume you sold your shares at the end of each period (unless otherwise noted). The Fund’s past performance, before and after taxes, is not necessarily an indication of how the Fund will perform in the future. Updated performance information is available online at www.morganstanley.com/im or by calling toll-free (800) 869-6397.
Performance Past Does Not Indicate Future [Text] The Fund’s past performance, before and after taxes, is not necessarily an indication of how the Fund will perform in the future.
Performance Information Illustrates Variability of Returns [Text] The bar chart and table below provide some indication of the risks of investing in the Fund by showing changes in the Fund’s Class I shares’ performance from year-to-year and by showing how the Fund’s average annual returns for the past one, five and ten year periods and since inception compare with those of a broad measure of market performance and one or more additional indexes.
Bar Chart [Heading] Annual Total Returns—Calendar Years
Bar Chart [Table]
image
Bar Chart Closing [Text Block]
High Quarter
06/30/20
46.33%
Low Quarter
06/30/22
-37.97%
Performance Table Heading Average Annual Total Returns1(for the calendar periods ended  December 31, 2025)
Performance Table Does Reflect Sales Loads The Fund’s returns in the table include the maximum applicable sales charge for Class A and Class C and assume you sold your shares at the end of each period (unless otherwise noted).
Performance Table Uses Highest Federal Rate The after-tax returns shown in the table above are calculated using the historical highest individual federal marginal income tax rates during the period shown and do not reflect the impact of state and local taxes.
Performance Table Not Relevant to Tax Deferred Actual after-tax returns depend on the investor’s tax situation and may differ from those shown, and after-tax returns are not relevant to investors who hold their Fund shares through tax deferred arrangements such as 401(k) plans or individual retirement accounts.
Performance Table Explanation after Tax Higher After-tax returns may be higher than before-tax returns due to an assumed benefit from capital losses that would have been realized had Fund shares been sold at the end of the relevant periods, as applicable.
Performance [Table]
 
Past
One Year
Past
Five Years
Past
Ten Years
Since
Inception
Class I1  (commenced operations on 6/30/2008)
 
Return Before Taxes
18.96%
0.58%
12.36%
12.01%
Return After Taxes on Distributions2
18.95%
-1.65%
10.48%
10.57%
Return After Taxes on Distributions and Sale of Fund Shares
11.23%
-0.24%
9.65%
9.87%
Class A (commenced operations on 5/21/2010)
 
Return Before Taxes
12.31%
-0.83%
11.40%
13.41%
Class L1  (commenced operations on 6/30/2008)
 
Return Before Taxes
18.76%
0.44%
12.23%
11.87%
Class C (commenced operations on 4/30/2015)
 
Return Before Taxes
16.65%
-0.48%
11.35%
11.06%3
Class R6 (commenced operations on 9/13/2013)
 
Return Before Taxes
19.01%
0.62%
12.41%
12.99%
S&P 500® Index (reflects no deduction for fees, expenses or taxes)4
17.88%
14.42%
14.82%
12.19%5
Russell 1000® Growth Index (reflects no deduction for fees, expenses or taxes)6
18.56%
15.32%
18.13%
14.57%5
[1],[2],[3],[4],[5],[6]
Performance Table One Class of after Tax Shown [Text] After-tax returns for the Fund’s other classes will vary from Class I shares’ returns.
Performance Table Closing [Text Block]
The after-tax returns shown in the table above are calculated using the historical highest individual federal marginal income tax rates during the period shown and do not reflect the impact of state and local taxes. After-tax returns for the Fund’s other classes will vary from Class I shares’ returns. Actual after-tax returns depend on the investor’s tax situation and may differ from those shown, and after-tax returns are not relevant to investors who hold their Fund shares through tax deferred arrangements such as 401(k) plans or individual retirement accounts. After-tax returns may be higher than before-tax returns due to an assumed benefit from capital losses that would have been realized had Fund shares been sold at the end of the relevant periods, as applicable.
Performance Availability Website Address [Text] www.morganstanley.com/im
Performance Availability Phone [Text] (800) 869-6397
(MSIF - Counterpoint Global Portfolios) | Advantage Portfolio | Class I  
Prospectus [Line Items]  
Highest Quarterly Return, Label [Optional Text] High Quarter
Highest Quarterly Return 46.33%
Highest Quarterly Return, Date Jun. 30, 2020
Lowest Quarterly Return, Label [Optional Text] Low Quarter
Lowest Quarterly Return (37.97%)
Lowest Quarterly Return, Date Jun. 30, 2022
(MSIF - Counterpoint Global Portfolios) | Global Endurance Portfolio  
Prospectus [Line Items]  
Bar Chart and Performance Table [Heading] Performance Information
Performance Narrative [Text Block]
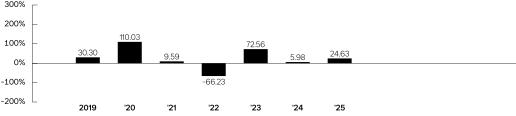
The bar chart and table below provide some indication of the risks of investing in the Fund by showing changes in the Fund’s Class I shares’ performance from year-to-year and by showing how the Fund’s average annual returns for the past one and five year periods and since inception compare with those of a broad measure of market performance.  The performance of the other classes, which is shown in the table below, will differ because the classes have different ongoing fees. The Fund’s returns in the table include the maximum applicable sales charge for Class A and Class C and assume you sold your shares at the end of each period (unless otherwise noted). The Fund’s past performance, before and after taxes, is not necessarily an indication of how the Fund will perform in the future. Updated performance information is available online at www.morganstanley.com/im or by calling toll-free 1-800-869-6397.
Performance Past Does Not Indicate Future [Text] The Fund’s past performance, before and after taxes, is not necessarily an indication of how the Fund will perform in the future.
Performance Information Illustrates Variability of Returns [Text] The bar chart and table below provide some indication of the risks of investing in the Fund by showing changes in the Fund’s Class I shares’ performance from year-to-year and by showing how the Fund’s average annual returns for the past one and five year periods and since inception compare with those of a broad measure of market performance.
Bar Chart [Heading] Annual Total Returns—Calendar Years
Bar Chart [Table]
image
Bar Chart Closing [Text Block]
High Quarter
06/30/20
75.29%
Low Quarter
06/30/22
-40.60%
Performance Table Heading Average Annual Total Returns (for the calendar periods ended  December 31, 2025)
Performance Table Does Reflect Sales Loads The Fund’s returns in the table include the maximum applicable sales charge for Class A and Class C and assume you sold your shares at the end of each period (unless otherwise noted).
Performance Table Uses Highest Federal Rate The after-tax returns shown in the table above are calculated using the historical highest individual federal marginal income tax rates during the period shown and do not reflect the impact of state and local taxes.
Performance Table Not Relevant to Tax Deferred Actual after-tax returns depend on the investor’s tax situation and may differ from those shown, and after-tax returns are not relevant to investors who hold their Fund shares through tax deferred arrangements such as 401(k) plans or individual retirement accounts.
Performance Table Explanation after Tax Higher After-tax returns may be higher than before-tax returns due to an assumed benefit from capital losses that would have been realized had Fund shares been sold at the end of the relevant periods, as applicable.
Performance [Table]
 
Past
One Year
Past
Five Years
Since
Inception
Class I (commenced operations on 12/31/2018)
 
 
Return Before Taxes
24.63%
-3.35%
12.69%
Return After Taxes on Distributions1
24.43%
-3.80%
12.19%
Return After Taxes on Distributions and Sale of Fund Shares
14.65%
-2.60%
10.31%
Class A (commenced operations on 12/31/2018)
 
 
Return Before Taxes
17.78%
-4.72%
11.43%
Class C (commenced operations on    12/31/2018)
 
 
Return Before Taxes
22.28%
-4.39%
11.46%
Class R6 (commenced operations on    12/31/2018)
 
 
Return Before Taxes
24.72%
-3.31%
12.74%
MSCI All Country World Net Index (reflects no deduction for fees, expenses or taxes)2
22.34%
11.19%
14.00%3
[7],[8],[9]
Performance Table One Class of after Tax Shown [Text] After-tax returns for the Fund’s other classes will vary from Class I shares’ returns.
Performance Table Closing [Text Block]
The after-tax returns shown in the table above are calculated using the historical highest individual federal marginal income tax rates during the period shown and do not reflect the impact of state and local taxes. After-tax returns for the Fund’s other classes will vary from Class I shares’ returns. Actual after-tax returns depend on the investor’s tax situation and may differ from those shown, and after-tax returns are not relevant to investors who hold their Fund shares through tax deferred arrangements such as 401(k) plans or individual retirement accounts. After-tax returns may be higher than before-tax returns due to an assumed benefit from capital losses that would have been realized had Fund shares been sold at the end of the relevant periods, as applicable.
Performance Availability Website Address [Text] www.morganstanley.com/im
Performance Availability Phone [Text] 1-800-869-6397
(MSIF - Counterpoint Global Portfolios) | Global Endurance Portfolio | Class I  
Prospectus [Line Items]  
Highest Quarterly Return, Label [Optional Text] High Quarter
Highest Quarterly Return 75.29%
Highest Quarterly Return, Date Jun. 30, 2020
Lowest Quarterly Return, Label [Optional Text] Low Quarter
Lowest Quarterly Return (40.60%)
Lowest Quarterly Return, Date Jun. 30, 2022
(MSIF - Counterpoint Global Portfolios) | Global Insight Portfolio  
Prospectus [Line Items]  
Bar Chart and Performance Table [Heading] Performance Information
Performance Narrative [Text Block]
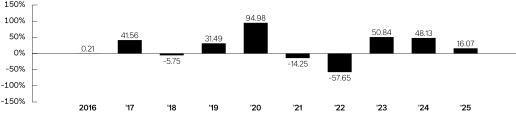
The bar chart and table below provide some indication of the risks of investing in the Fund by showing changes in the Fund’s Class I shares’ performance from year-to-year and by showing how the Fund’s average annual returns for the past one, five and ten year periods and since inception compare with those of a broad measure of market performance.  The performance of the other classes, which is shown in the table below, will differ because the classes have different ongoing fees. The Fund’s returns in the table include the maximum applicable sales charge for Class A and Class C and assume you sold your shares at the end of each period (unless otherwise noted). The Fund’s past performance, before and after taxes, is not necessarily an indication of how the Fund will perform in the future. Updated performance information is available online at www.morganstanley.com/im or by calling toll-free 1-800-869-6397.
Performance Past Does Not Indicate Future [Text] The Fund’s past performance, before and after taxes, is not necessarily an indication of how the Fund will perform in the future.
Performance Information Illustrates Variability of Returns [Text] The bar chart and table below provide some indication of the risks of investing in the Fund by showing changes in the Fund’s Class I shares’ performance from year-to-year and by showing how the Fund’s average annual returns for the past one, five and ten year periods and since inception compare with those of a broad measure of market performance.
Bar Chart [Heading] Annual Total Returns—Calendar Years
Bar Chart [Table]
image
Bar Chart Closing [Text Block]
High Quarter
06/30/20
57.81%
Low Quarter
06/30/22
-36.62%
Performance Table Heading Average Annual Total Returns(for the calendar periods ended  December 31, 2025)
Performance Table Does Reflect Sales Loads The Fund’s returns in the table include the maximum applicable sales charge for Class A and Class C and assume you sold your shares at the end of each period (unless otherwise noted).
Performance Table Uses Highest Federal Rate The after-tax returns shown in the table above are calculated using the historical highest individual federal marginal income tax rates during the period shown and do not reflect the impact of state and local taxes.
Performance Table Not Relevant to Tax Deferred Actual after-tax returns depend on the investor’s tax situation and may differ from those shown, and after-tax returns are not relevant to investors who hold their Fund shares through tax deferred arrangements such as 401(k) plans or individual retirement accounts.
Performance Table Explanation after Tax Higher After-tax returns may be higher than before-tax returns due to an assumed benefit from capital losses that would have been realized had Fund shares been sold at the end of the relevant periods, as applicable.
Performance [Table]
 
Past
One Year
Past
Five Years
Past
Ten Years
Since
Inception
Class I (commenced operations on 12/28/2010)
 
Return Before Taxes
16.07%
-1.19%
12.43%
11.90%
Return After Taxes on Distributions1
16.07%
-3.35%
10.61%
10.19%
Return After Taxes on Distributions and Sale of Fund Shares
9.51%
-1.33%
9.90%
9.62%
Class A (commenced operations on 12/28/2010)
 
Return Before Taxes
9.63%
-2.55%
11.48%
11.16%
Class L (commenced operations on 12/28/2010)
 
Return Before Taxes
15.13%
-2.02%
11.48%
10.98%
Class C (commenced operations on 4/30/2015)
 
Return Before Taxes
13.85%
-2.24%
11.39%
10.39%2
Class R6  (commenced operations on 6/14/2021)
Return Before Taxes
16.08%
N/A
N/A
-1.00%
MSCI All Country World Net Index (reflects no deduction for fees, expenses or taxes)3
22.34%
11.19%
11.72%
9.85%4
[10],[11],[12],[13]
Performance Table One Class of after Tax Shown [Text] After-tax returns for the Fund’s other classes will vary from Class I shares’ returns.
Performance Table Closing [Text Block]
The after-tax returns shown in the table above are calculated using the historical highest individual federal marginal income tax rates during the period shown and do not reflect the impact of state and local taxes. After-tax returns for the Fund’s other classes will vary from Class I shares’ returns. Actual after-tax returns depend on the investor’s tax situation and may differ from those shown, and after-tax returns are not relevant to investors who hold their Fund shares through tax deferred arrangements such as 401(k) plans or individual retirement accounts. After-tax returns may be higher than before-tax returns due to an assumed benefit from capital losses that would have been realized had Fund shares been sold at the end of the relevant periods, as applicable.
Performance Availability Website Address [Text] www.morganstanley.com/im
Performance Availability Phone [Text] 1-800-869-6397
(MSIF - Counterpoint Global Portfolios) | Global Insight Portfolio | Class I  
Prospectus [Line Items]  
Highest Quarterly Return, Label [Optional Text] High Quarter
Highest Quarterly Return 57.81%
Highest Quarterly Return, Date Jun. 30, 2020
Lowest Quarterly Return, Label [Optional Text] Low Quarter
Lowest Quarterly Return (36.62%)
Lowest Quarterly Return, Date Jun. 30, 2022
(MSIF - Counterpoint Global Portfolios) | Global Permanence Portfolio  
Prospectus [Line Items]  
Bar Chart and Performance Table [Heading] Performance Information
Performance Narrative [Text Block]
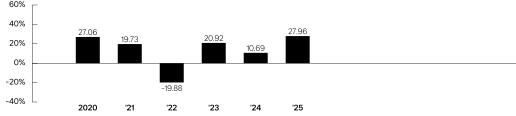
The bar chart and table below provide some indication of the risks of investing in the Fund by showing changes in the Fund’s Class I shares’ performance from year to year and by showing how the Fund’s average annual returns for the past one and five year periods and since inception compare with those of a broad measure of market performance. The performance of the other classes, which is shown in the table below, will differ because the classes have different ongoing fees. The Fund’s returns in the table include the maximum applicable sales charge for Class A and Class C and assume you sold your shares at the end of each period (unless otherwise noted). The Fund’s past performance, before and after taxes, is not necessarily an indication of how the Fund will perform in the future. Updated performance information is available online at www.morganstanley.com/im or by calling toll-free 1-800-869-6397.
Performance Past Does Not Indicate Future [Text] The Fund’s past performance, before and after taxes, is not necessarily an indication of how the Fund will perform in the future.
Performance Information Illustrates Variability of Returns [Text] The bar chart and table below provide some indication of the risks of investing in the Fund by showing changes in the Fund’s Class I shares’ performance from year to year and by showing how the Fund’s average annual returns for the past one and five year periods and since inception compare with those of a broad measure of market performance.
Bar Chart [Heading] Annual Total Returns—Calendar Years
Bar Chart [Table]
image
Bar Chart Closing [Text Block]
High Quarter
06/30/20
26.97%
Low Quarter
03/31/20
-17.69%
Performance Table Heading Average Annual Total Returns (for the calendar periods ended  December 31, 2025)
Performance Table Does Reflect Sales Loads The Fund’s returns in the table include the maximum applicable sales charge for Class A and Class C and assume you sold your shares at the end of each period (unless otherwise noted).
Performance Table Uses Highest Federal Rate The after-tax returns shown in the table above are calculated using the historical highest individual federal marginal income tax rates during the period shown and do not reflect the impact of state and local taxes.
Performance Table Not Relevant to Tax Deferred Actual after-tax returns depend on the investor’s tax situation and may differ from those shown, and after-tax returns are not relevant to investors who hold their Fund shares through tax deferred arrangements such as 401(k) plans or individual retirement accounts.
Performance Table Explanation after Tax Higher After-tax returns may be higher than before-tax returns due to an assumed benefit from capital losses that would have been realized had Fund shares been sold at the end of the relevant periods, as applicable.
Performance [Table]
 
Past
One Year
Past
Five Years
Since Inception
Class I (commenced operations on 4/30/2019)
 
 
Return Before Taxes
27.96%
10.44%
12.69%
Return After Taxes on Distributions1
18.83%
6.63%
9.72%
Return After Taxes on Distributions and Sale of Fund Shares
16.54%
7.03%
9.31%
Class A (commenced operations on 4/30/2019)
 
 
Return Before Taxes
20.80%
8.87%
11.40%
Class C (commenced operations on 4/30/2019)
 
 
Return Before Taxes
25.52%
9.24%
11.47%
Class R6 (commenced operations on 4/30/2019)
 
 
Return Before Taxes
27.95%
10.49%
12.75%
MSCI All Country World Net Index (reflects no deduction for fees, expenses or taxes)2
22.34%
11.19%
12.22%3
[14],[15],[16]
Performance Table One Class of after Tax Shown [Text] After-tax returns for the Fund’s other classes will vary from Class I shares’ returns.
Performance Table Closing [Text Block]
The after-tax returns shown in the table above are calculated using the historical highest individual federal marginal income tax rates during the period shown and do not reflect the impact of state and local taxes. After-tax returns for the Fund’s other classes will vary from Class I shares’ returns. Actual after-tax returns depend on the investor’s tax situation and may differ from those shown, and after-tax returns are not relevant to investors who hold their Fund shares through tax deferred arrangements such as 401(k) plans or individual retirement accounts. After-tax returns may be higher than before-tax returns due to an assumed benefit from capital losses that would have been realized had Fund shares been sold at the end of the relevant periods, as applicable.
Performance Availability Website Address [Text] www.morganstanley.com/im
Performance Availability Phone [Text] 1-800-869-6397
(MSIF - Counterpoint Global Portfolios) | Global Permanence Portfolio | Class I  
Prospectus [Line Items]  
Highest Quarterly Return, Label [Optional Text] High Quarter
Highest Quarterly Return 26.97%
Highest Quarterly Return, Date Jun. 30, 2020
Lowest Quarterly Return, Label [Optional Text] Low Quarter
Lowest Quarterly Return (17.69%)
Lowest Quarterly Return, Date Mar. 31, 2020
(MSIF - Counterpoint Global Portfolios) | Growth Portfolio  
Prospectus [Line Items]  
Bar Chart and Performance Table [Heading] Performance Information
Performance Narrative [Text Block]
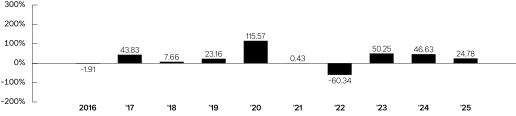
The bar chart and table below provide some indication of the risks of investing in the Fund by showing changes in the Fund’s Class I shares’ performance from year-to-year and by showing how the Fund’s average annual returns for the past one, five and ten year periods and since inception compare with those of a broad measure of market performance and one or more additional indexes. The additional index(es) in the table provides a means to compare the Fund’s average annual total returns to a benchmark that the Adviser believes is representative of the Fund’s investment universe. The performance of the other classes, which is shown in the table below, will differ because the classes have different ongoing fees. The Fund’s returns in the table include the maximum applicable sales charge for Class A and Class  C and assume you sold your shares at the end of each period (unless otherwise noted). The Fund’s past performance, before and after taxes, is not necessarily an indication of how the Fund will perform in the future. Updated performance information is available online at www.morganstanley.com/im or by calling toll-free 1-800-869-6397.
Performance Past Does Not Indicate Future [Text] The Fund’s past performance, before and after taxes, is not necessarily an indication of how the Fund will perform in the future.
Performance Information Illustrates Variability of Returns [Text] The bar chart and table below provide some indication of the risks of investing in the Fund by showing changes in the Fund’s Class I shares’ performance from year-to-year and by showing how the Fund’s average annual returns for the past one, five and ten year periods and since inception compare with those of a broad measure of market performance and one or more additional indexes.
Bar Chart [Heading] Annual Total Returns—Calendar Years
Bar Chart [Table]
image
Bar Chart Closing [Text Block]
High Quarter
06/30/20
58.32%
Low Quarter
06/30/22
-41.20%
Performance Table Heading Average Annual Total Returns(for the calendar periods ended  December 31, 2025)
Performance Table Does Reflect Sales Loads The Fund’s returns in the table include the maximum applicable sales charge for Class A and Class  C and assume you sold your shares at the end of each period (unless otherwise noted).
Performance Table Uses Highest Federal Rate The after-tax returns shown in the table above are calculated using the historical highest individual federal marginal income tax rates during the period shown and do not reflect the impact of state and local taxes.
Performance Table Not Relevant to Tax Deferred Actual after-tax returns depend on the investor’s tax situation and may differ from those shown, and after-tax returns are not relevant to investors who hold their Fund shares through tax deferred arrangements such as 401(k) plans or individual retirement accounts.
Performance Table Explanation after Tax Higher After-tax returns may be higher than before-tax returns due to an assumed benefit from capital losses that would have been realized had Fund shares been sold at the end of the relevant periods, as applicable.
Performance [Table]
 
Past
One Year
Past
Five Years
Past
Ten Years
Since
Inception
Class I (commenced operations on 4/2/1991)
Return Before Taxes
24.78%
1.83%
16.01%
12.00%
Return After Taxes on Distributions1
24.78%
0.06%
13.38%
10.21%
Return After Taxes on Distributions and Sale of Fund Shares
14.67%
0.92%
12.45%
9.81%
Class A (commenced operations on 1/2/1996)
Return Before Taxes
17.89%
0.48%
15.08%
11.14%
Class L (commenced operations on 4/27/2012)
Return Before Taxes
23.83%
1.07%
15.13%
15.02%
Class C (commenced operations on 4/30/2015)
Return Before Taxes
22.50%
0.82%
15.02%
14.36%2
Class R6  (commenced operations on 9/13/2013)
Return Before Taxes
24.90%
1.92%
16.11%
15.96%
 
Past
One Year
Past
Five Years
Past
Ten Years
Since
Inception
Russell 1000® Index (reflects no deduction for fees, expenses or taxes)3
17.37%
13.59%
14.59%
10.92%4
Russell 1000® Growth Index (reflects no deduction for fees, expenses or taxes)5
18.56%
15.32%
18.13%
11.29%4
[17],[18],[19],[20],[21]
Performance Table One Class of after Tax Shown [Text] After-tax returns for the Fund’s other classes will vary from Class I shares’ returns.
Performance Table Closing [Text Block]
The after-tax returns shown in the table above are calculated using the historical highest individual federal marginal income tax rates during the period shown and do not reflect the impact of state and local taxes. After-tax returns for the Fund’s other classes will vary from Class I shares’ returns. Actual after-tax returns depend on the investor’s tax situation and may differ from those shown, and after-tax returns are not relevant to investors who hold their Fund shares through tax deferred arrangements such as 401(k) plans or individual retirement accounts. After-tax returns may be higher than before-tax returns due to an assumed benefit from capital losses that would have been realized had Fund shares been sold at the end of the relevant periods, as applicable.
Performance Availability Website Address [Text] www.morganstanley.com/im
Performance Availability Phone [Text] 1-800-869-6397
(MSIF - Counterpoint Global Portfolios) | Growth Portfolio | Class I  
Prospectus [Line Items]  
Highest Quarterly Return, Label [Optional Text] High Quarter
Highest Quarterly Return 58.32%
Highest Quarterly Return, Date Jun. 30, 2020
Lowest Quarterly Return, Label [Optional Text] Low Quarter
Lowest Quarterly Return (41.20%)
Lowest Quarterly Return, Date Jun. 30, 2022
(MSIF - Counterpoint Global Portfolios) | Inception Portfolio  
Prospectus [Line Items]  
Bar Chart and Performance Table [Heading] Performance Information
Performance Narrative [Text Block]
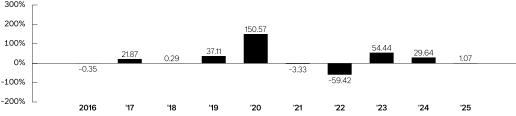
The bar chart and table below provide some indication of the risks of investing in the Fund by showing changes in the Fund’s Class I shares’ performance from year-to-year and by showing how the Fund’s average annual returns for the past one, five and ten year periods and since inception compare with those of a broad measure of market performance and one or more additional indexes. The additional index(es) in the table provides a means to compare the Fund’s average annual total returns to a benchmark that the Adviser believes is representative of the Fund’s investment universe. The performance of the other classes, which is shown in the table below, will differ because the classes have different ongoing fees. The Fund’s returns in the table include the maximum applicable sales charge for Class A and Class  C and assume you sold your shares at the end of each period (unless otherwise noted). The Fund’s past performance, before and after taxes, is not necessarily an indication of how the Fund will perform in the future. Updated performance information is available online at www.morganstanley.com/im or by calling toll-free 1-800-869-6397.
Performance Past Does Not Indicate Future [Text] The Fund’s past performance, before and after taxes, is not necessarily an indication of how the Fund will perform in the future.
Performance Information Illustrates Variability of Returns [Text] The bar chart and table below provide some indication of the risks of investing in the Fund by showing changes in the Fund’s Class I shares’ performance from year-to-year and by showing how the Fund’s average annual returns for the past one, five and ten year periods and since inception compare with those of a broad measure of market performance and one or more additional indexes.
Bar Chart [Heading] Annual Total Returns—Calendar Years
Bar Chart [Table]
image
Bar Chart Closing [Text Block]
High Quarter
06/30/20
72.82%
Low Quarter
06/30/22
-36.24%
Performance Table Heading Average Annual Total Returns(for the calendar periods ended  December 31, 2025)
Performance Table Does Reflect Sales Loads The Fund’s returns in the table include the maximum applicable sales charge for Class A and Class  C and assume you sold your shares at the end of each period (unless otherwise noted).
Performance Table Uses Highest Federal Rate The after-tax returns shown in the table above are calculated using the historical highest individual federal marginal income tax rates during the period shown and do not reflect the impact of state and local taxes.
Performance Table Not Relevant to Tax Deferred Actual after-tax returns depend on the investor’s tax situation and may differ from those shown, and after-tax returns are not relevant to investors who hold their Fund shares through tax deferred arrangements such as 401(k) plans or individual retirement accounts.
Performance Table Explanation after Tax Higher After-tax returns may be higher than before-tax returns due to an assumed benefit from capital losses that would have been realized had Fund shares been sold at the end of the relevant periods, as applicable.
Performance [Table]
 
Past
One Year
Past
Five Years
Past  
Ten Years
Since
Inception
Class I (commenced operations on 11/1/1989)
Return Before Taxes
1.07%
-4.51%
12.75%
11.17%
Return After Taxes on Distributions1
1.07%
-6.10%
9.43%
8.56%
Return After Taxes on Distributions and Sale of Fund Shares
0.63%
-3.81%
9.14%
8.44%
Class A (commenced operations on 1/2/1996)
Return Before Taxes
-4.51%
-5.84%
11.81%
10.22%
Class L (commenced operations on 11/11/2011)
Return Before Taxes
0.23%
-5.38%
11.78%
11.07%
Class C (commenced operations on 5/31/2017)
Return Before Taxes
-1.00%
-5.56%
N/A
11.88%2
Class R6  (commenced operations on 9/13/2013)
Return Before Taxes
1.12%
-4.48%
12.82%
9.87%
Russell 3000® Index (reflects no deduction for fees, expenses or taxes)3
17.15%
13.15%
14.29%
10.79%4
Russell 2000® Growth Index (reflects no deduction for fees, expenses or taxes)5
13.01%
3.18%
9.57%
8.13%4
[22],[23],[24],[25],[26]
Performance Table One Class of after Tax Shown [Text] After-tax returns for the Fund’s other classes will vary from Class I shares’ returns.
Performance Table Closing [Text Block]
The after-tax returns shown in the table above are calculated using the historical highest individual federal marginal income tax rates during the period shown and do not reflect the impact of state and local taxes. After-tax returns for the Fund’s other classes will vary from Class I shares’ returns. Actual after-tax returns depend on the investor’s tax situation and may differ from those shown, and after-tax returns are not relevant to investors who hold their Fund shares through tax deferred arrangements such as 401(k) plans or individual retirement accounts. After-tax returns may be higher than before-tax returns
due to an assumed benefit from capital losses that would have been realized had Fund shares been sold at the end of the relevant periods, as applicable.
Performance Availability Website Address [Text] www.morganstanley.com/im
Performance Availability Phone [Text] 1-800-869-6397
(MSIF - Counterpoint Global Portfolios) | Inception Portfolio | Class I  
Prospectus [Line Items]  
Highest Quarterly Return, Label [Optional Text] High Quarter
Highest Quarterly Return 72.82%
Highest Quarterly Return, Date Jun. 30, 2020
Lowest Quarterly Return, Label [Optional Text] Low Quarter
Lowest Quarterly Return (36.24%)
Lowest Quarterly Return, Date Jun. 30, 2022
(MSIF - Counterpoint Global Portfolios) | Permanence Portfolio  
Prospectus [Line Items]  
Bar Chart and Performance Table [Heading] Performance Information
Performance Narrative [Text Block]
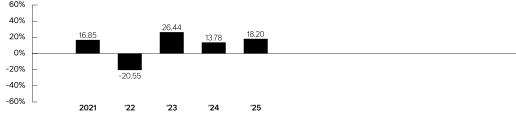
The bar chart and table below provide some indication of the risks of investing in the Fund by showing changes in the Fund’s Class I shares’ performance from year-to-year and by showing how the Fund’s average annual returns for the past one and five year periods and since inception compare with those of a broad measure of market performance. The performance of the other classes, which is shown in the table below, will differ because the classes have different ongoing fees. The Fund’s returns in the table include the maximum applicable sales charge for Class A and Class C and assume you sold your shares at the end of each period (unless otherwise noted). The Fund’s past performance, before and after taxes, is not necessarily an indication of how the Fund will perform in the future. Updated performance information is available online at www.morganstanley.com/im or by calling toll-free 1-800-869-6397.
Performance Past Does Not Indicate Future [Text] The Fund’s past performance, before and after taxes, is not necessarily an indication of how the Fund will perform in the future.
Performance Information Illustrates Variability of Returns [Text] The bar chart and table below provide some indication of the risks of investing in the Fund by showing changes in the Fund’s Class I shares’ performance from year-to-year and by showing how the Fund’s average annual returns for the past one and five year periods and since inception compare with those of a broad measure of market performance.
Bar Chart [Heading] Annual Total Returns—Calendar Years
Bar Chart [Table]
image
Bar Chart Closing [Text Block]
High Quarter
06/30/25
17.86%
Low Quarter
06/30/22
-15.49%
Performance Table Heading Average Annual Total Returns (for the calendar periods ended  December 31, 2025)
Performance Table Does Reflect Sales Loads The Fund’s returns in the table include the maximum applicable sales charge for Class A and Class C and assume you sold your shares at the end of each period (unless otherwise noted).
Performance Table Uses Highest Federal Rate The after-tax returns shown in the table above are calculated using the historical highest individual federal marginal income tax rates during the period shown and do not reflect the impact of state and local taxes.
Performance Table Not Relevant to Tax Deferred Actual after-tax returns depend on the investor’s tax situation and may differ from those shown, and after-tax returns are not relevant to investors who hold their Fund shares through tax deferred arrangements such as 401(k) plans or individual retirement accounts.
Performance Table Explanation after Tax Higher After-tax returns may be higher than before-tax returns due to an assumed benefit from capital losses that would have been realized had Fund shares been sold at the end of the relevant periods, as applicable.
Performance [Table]
 
Past
One Year
Past
Five Years
Since
Inception
Class I  (commenced operations on 3/31/2020)
 
 
Return Before Taxes
18.20%
9.56%
16.89%
Return After Taxes on Distributions1
13.03%
6.01%
13.13%
Return After Taxes on Distributions and Sale of Fund Shares
12.34%
6.47%
12.46%
Class A (commenced operations on 3/31/2020)
 
 
Return Before Taxes
11.53%
8.01%
15.41%
 
Past
One Year
Past
Five Years
Since
Inception
Class C (commenced operations on 3/31/2020)
 
 
Return Before Taxes
15.77%
8.34%
15.58%
Class R6  (commenced operations on 3/31/2020)
 
 
Return Before Taxes
18.13%
9.62%
16.94%
S&P 500® Index (reflects no deduction for fees, expenses or taxes)2
17.88%
14.42%
20.25%3
[27],[28],[29]
Performance Table One Class of after Tax Shown [Text] After-tax returns for the Fund’s other classes will vary from Class I shares’ returns.
Performance Table Closing [Text Block]
The after-tax returns shown in the table above are calculated using the historical highest individual federal marginal income tax rates during the period shown and do not reflect the impact of state and local taxes. After-tax returns for the Fund’s other classes will vary from Class I shares’ returns. Actual after-tax returns depend on the investor’s tax situation and may differ from those shown, and after-tax returns are not relevant to investors who hold their Fund shares through tax deferred arrangements such as 401(k) plans or individual retirement accounts. After-tax returns may be higher than before-tax returns due to an assumed benefit from capital losses that would have been realized had Fund shares been sold at the end of the relevant periods, as applicable.
Performance Availability Website Address [Text] www.morganstanley.com/im
Performance Availability Phone [Text] 1-800-869-6397
(MSIF - Counterpoint Global Portfolios) | Permanence Portfolio | Class I  
Prospectus [Line Items]  
Highest Quarterly Return, Label [Optional Text] High Quarter
Highest Quarterly Return 17.86%
Highest Quarterly Return, Date Jun. 30, 2025
Lowest Quarterly Return, Label [Optional Text] Low Quarter
Lowest Quarterly Return (15.49%)
Lowest Quarterly Return, Date Jun. 30, 2022
(MSIF - Counterpoint Global Portfolios) | Vitality Portfolio  
Prospectus [Line Items]  
Bar Chart and Performance Table [Heading] Performance Information
Performance Narrative [Text Block]
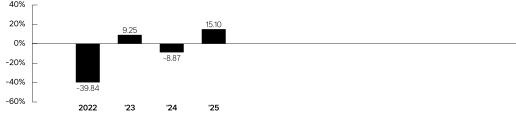
The bar chart and table below provide some indication of the risks of investing in the Fund by showing changes in the Fund’s Class I shares’ performance from year-to-year and by showing how the Fund’s average annual returns for the past one year period and since inception compare with those of a broad measure of market performance and one or more additional indexes. The additional index(es) in the table provides a means to compare the Fund’s average annual total returns to a benchmark that the Adviser believes is representative of the Fund’s investment universe. The performance of the other classes, which is shown in the table below, will differ because the classes have different ongoing fees. The Fund’s returns in the table include the maximum applicable sales charge for Class A and Class C and assume you sold your shares at the end of each period (unless otherwise noted). The Fund’s past performance, before and after taxes, is not necessarily an indication of how the Fund will perform in the future. Updated performance information is available online at  www.morganstanley.com/im or by calling toll-free 1-800-869-6397.
Performance Past Does Not Indicate Future [Text] The Fund’s past performance, before and after taxes, is not necessarily an indication of how the Fund will perform in the future.
Performance Information Illustrates Variability of Returns [Text] The bar chart and table below provide some indication of the risks of investing in the Fund by showing changes in the Fund’s Class I shares’ performance from year-to-year and by showing how the Fund’s average annual returns for the past one year period and since inception compare with those of a broad measure of market performance and one or more additional indexes.
Bar Chart [Heading] Annual Total Returns—Calendar Years
Bar Chart [Table]
image
Bar Chart Closing [Text Block]
High Quarter
12/31/25
15.10%
Low Quarter
06/30/22
-24.06%
Performance Table Heading Average Annual Total Returns (for the calendar periods ended  December 31, 2025)
Performance Table Does Reflect Sales Loads The Fund’s returns in the table include the maximum applicable sales charge for Class A and Class C and assume you sold your shares at the end of each period (unless otherwise noted).
Performance Table Uses Highest Federal Rate The after-tax returns shown in the table above are calculated using the historical highest individual federal marginal income tax rates during the period shown and do not reflect the impact of state and local taxes.
Performance Table Not Relevant to Tax Deferred Actual after-tax returns depend on the investor’s tax situation and may differ from those shown, and after-tax returns are not relevant to investors who hold their Fund shares through tax deferred arrangements such as 401(k) plans or individual retirement accounts.
Performance Table Explanation after Tax Higher After-tax returns may be higher than before-tax returns due to an assumed benefit from capital losses that would have been realized had Fund shares been sold at the end of the relevant periods, as applicable.
Performance [Table]
 
Past
One Year
Since
Inception
Class I  (commenced operations on 12/31/2021)
 
Return Before Taxes
15.10%
-8.88%
Return After Taxes on Distributions1
14.45%
-9.28%
Return After Taxes on Distributions and Sale of Fund Shares
8.99%
-6.68%
Class A (commenced operations on 12/31/2021)
 
Return Before Taxes
8.66%
-10.39%
Class C (commenced operations on 12/31/2021)
 
Return Before Taxes
12.63%
-9.89%
Class R6  (commenced operations on 12/31/2021)
 
Return Before Taxes
14.95%
-8.84%
Russell 3000® Index (reflects no deduction for fees, expenses or taxes)2
17.15%
10.22%3
Russell 3000® Health Care Net Index (reflects no deduction for fees, expenses or taxes)4
14.02%
2.98%3
[30],[31],[32],[33]
Performance Table One Class of after Tax Shown [Text] After-tax returns for the Fund’s other classes will vary from Class I shares’ returns.
Performance Table Closing [Text Block]
The after-tax returns shown in the table above are calculated using the historical highest individual federal marginal income tax rates during the period shown and do not reflect the impact of state and local taxes. After-tax returns for the Fund’s other classes will vary from Class I shares’ returns. Actual after-tax returns depend on the investor’s tax situation and may differ from those shown, and after-tax returns are not relevant to investors who hold their Fund shares through tax deferred arrangements such as 401(k) plans or individual retirement accounts. After-tax returns may be higher than before-tax returns due to an assumed benefit from capital losses that would have been realized had Fund shares been sold at the end of the relevant periods, as applicable.
Performance Availability Website Address [Text] www.morganstanley.com/im
Performance Availability Phone [Text] 1-800-869-6397
(MSIF - Counterpoint Global Portfolios) | Vitality Portfolio | Class I  
Prospectus [Line Items]  
Highest Quarterly Return, Label [Optional Text] High Quarter
Highest Quarterly Return 15.10%
Highest Quarterly Return, Date Dec. 31, 2025
Lowest Quarterly Return, Label [Optional Text] Low Quarter
Lowest Quarterly Return (24.06%)
Lowest Quarterly Return, Date Jun. 30, 2022
(MSIF - Opportunity Portfolios) | Asia Opportunity Portfolio  
Prospectus [Line Items]  
Bar Chart and Performance Table [Heading] Performance Information
Performance Narrative [Text Block]
The bar chart and table below provide some indication of the risks of investing in the Fund by showing changes in the Fund’s Class I shares’ performance from year-to-year and by showing how the Fund’s average annual returns for the past one, five and ten year periods and since inception compare with those of a broad measure of market performance. The performance of
the other classes, which is shown in the table below, will differ because the classes have different ongoing fees. The Fund’s returns in the table include the maximum applicable sales charge for Class A and Class C and assume you sold your shares at the end of each period (unless otherwise noted). The    Fund’s past performance, before and after taxes, is not necessarily an indication of how the Fund will perform in the future. Updated performance information is available online at www.morganstanley.com/im  or by calling toll-free 1-800-869-6397.
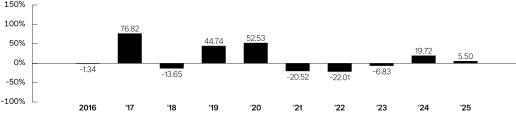
Performance Past Does Not Indicate Future [Text] The    Fund’s past performance, before and after taxes, is not necessarily an indication of how the Fund will perform in the future.
Performance Information Illustrates Variability of Returns [Text] The bar chart and table below provide some indication of the risks of investing in the Fund by showing changes in the Fund’s Class I shares’ performance from year-to-year and by showing how the Fund’s average annual returns for the past one, five and ten year periods and since inception compare with those of a broad measure of market performance.
Bar Chart [Heading] Annual Total Returns—Calendar Years
Bar Chart [Table]
image
Bar Chart Closing [Text Block]
High Quarter
03/31/19
25.05%
Low Quarter
03/31/22
-18.81%
Performance Table Heading Average Annual Total Returns(for the calendar periods ended  December 31, 2025)
Performance Table Does Reflect Sales Loads The Fund’s returns in the table include the maximum applicable sales charge for Class A and Class C and assume you sold your shares at the end of each period (unless otherwise noted).
Performance Table Uses Highest Federal Rate The after-tax returns shown in the table above are calculated using the historical highest individual federal marginal income tax rates during the period shown and do not reflect the impact of state and local taxes.
Performance Table Not Relevant to Tax Deferred Actual after-tax returns depend on the investor’s tax situation and may differ from those shown, and after-tax returns are not relevant to investors who hold their Fund shares through tax deferred arrangements such as 401(k) plans or individual retirement accounts.
Performance Table Explanation after Tax Higher After-tax returns may be higher than before-tax returns due to an assumed benefit from capital losses that would have been realized had Fund shares been sold at the end of the relevant periods, as applicable.
Performance [Table]
 
Past
One Year
Past
Five Years
Past
Ten Years
Since Inception
Class I (commenced operations on 12/29/2015)


Return Before Taxes
5.50%
-6.11%
9.27%
9.30%
Return After Taxes on Distributions1
4.25%
-6.43%
8.90  %
8.93%
Return After Taxes on Distributions and Sale of Fund Shares
3.39%
-4.55%
7.51  %
7.54%
Class A (commenced operations on 12/29/2015)


Return Before Taxes
-0.38%
-7.40%
8.33%
8.37%
Class C (commenced operations on 12/29/2015)


Return Before Taxes
3.35%
-7.09%
8.28%
8.30%2
Class R6 (commenced operations on 12/29/2015)


Return Before Taxes
5.59%
-6.04%
9.33%
9.36%
MSCI All Country Asia ex Japan Net Index (reflects no deduction for fees, expenses or taxes)3
32.26%
3.73%
8.55%
8.52%4
[34],[35],[36],[37]
Performance Table One Class of after Tax Shown [Text] After-tax returns for the Fund’s other classes will vary from Class I shares’ returns.
Performance Table Closing [Text Block]
The after-tax returns shown in the table above are calculated using the historical highest individual federal marginal income tax rates during the period shown and do not reflect the impact of state and local taxes. After-tax returns for the Fund’s other classes will vary from Class I shares’ returns. Actual after-tax returns depend on the investor’s tax situation and may differ from those shown, and after-tax returns are not relevant to investors who hold their Fund shares through tax deferred arrangements such as 401(k) plans or individual retirement accounts. After-tax returns may be higher than before-tax returns due to an assumed benefit from capital losses that would have been realized had Fund shares been sold at the end of the relevant periods, as applicable.
Performance Availability Website Address [Text] www.morganstanley.com/im
Performance Availability Phone [Text] 1-800-869-6397
(MSIF - Opportunity Portfolios) | Asia Opportunity Portfolio | Class I  
Prospectus [Line Items]  
Highest Quarterly Return, Label [Optional Text] High Quarter
Highest Quarterly Return 25.05%
Highest Quarterly Return, Date Mar. 31, 2019
Lowest Quarterly Return, Label [Optional Text] Low Quarter
Lowest Quarterly Return (18.81%)
Lowest Quarterly Return, Date Mar. 31, 2022
(MSIF - Opportunity Portfolios) | Developing Opportunity Portfolio  
Prospectus [Line Items]  
Bar Chart and Performance Table [Heading] Performance Information
Performance Narrative [Text Block]
The bar chart and table below provide some indication of the risks of investing in the Fund by showing changes in the Fund’s Class I shares’ performance from year to year and by showing how the Fund’s average annual returns for the past one and five year periods and since inception compare with those of a broad measure of market performance. The performance of the other classes, which is shown in the table below, will differ because the classes have different ongoing fees. The Fund’s returns in the table include the maximum applicable sales charge for Class A and Class C and assume you sold your shares at the end of each period (unless otherwise noted). The Fund’s past performance, before and after taxes, is not necessarily an indication of how the Fund will perform in the future. Updated performance information is available online at www.morganstanley.com/im or by calling toll-free 1-800-869-6397.
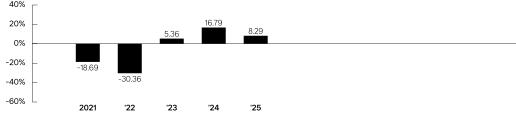
Performance Past Does Not Indicate Future [Text] The Fund’s past performance, before and after taxes, is not necessarily an indication of how the Fund will perform in the future.
Performance Information Illustrates Variability of Returns [Text] The bar chart and table below provide some indication of the risks of investing in the Fund by showing changes in the Fund’s Class I shares’ performance from year to year and by showing how the Fund’s average annual returns for the past one and five year periods and since inception compare with those of a broad measure of market performance.
Bar Chart [Heading] Annual Total Returns—Calendar Years
Bar Chart [Table]
image
Bar Chart Closing [Text Block]
High Quarter
09/30/24
14.06%
Low Quarter
03/31/22
-18.91%
Performance Table Heading Average Annual Total Returns (for the calendar periods ended  December 31, 2025)
Performance Table Does Reflect Sales Loads The Fund’s returns in the table include the maximum applicable sales charge for Class A and Class C and assume you sold your shares at the end of each period (unless otherwise noted).
Performance Table Uses Highest Federal Rate The after-tax returns shown in the table above are calculated using the historical highest individual federal marginal income tax rates during the period shown and do not reflect the impact of state and local taxes.
Performance Table Not Relevant to Tax Deferred Actual after-tax returns depend on the investor’s tax situation and may differ from those shown, and after-tax returns are not relevant to investors who hold their Fund shares through tax deferred arrangements such as 401(k) plans or individual retirement accounts.
Performance [Table]
 
Past
One Year
Past
Five Years
Since Inception
Class I (commenced operations on 2/14/2020)
 
 
Return Before Taxes
8.29%
-5.48%
1.54%
Return After Taxes on Distributions1
8.04%
-5.56%
1.47%
Return After Taxes on Distributions and Sale of Fund Shares
4.99%
-4.07%
1.17%
Class A (commenced operations on 2/14/2020)
 
 
Return Before Taxes
2.29%
-6.79%
0.31%
Class C (commenced operations on 2/14/2020)
 
 
Return Before Taxes
6.10%
-6.50%
0.44%
Class R6 (commenced operations on 2/14/2020)
 
 
Return Before Taxes
8.30%
-5.44%
1.59%
MSCI Emerging Markets Net Index (reflects no deduction for fees, expenses or taxes)2
33.57%
4.20%
6.69%3
[38],[39],[40]
Performance Table One Class of after Tax Shown [Text] After-tax returns for the Fund’s other classes will vary from Class I shares’ returns.
Performance Table Closing [Text Block]
The after-tax returns shown in the table above are calculated using the historical highest individual federal marginal income tax rates during the period shown and do not reflect the impact of state and local taxes. After-tax returns for the Fund’s other classes will vary from Class I shares’ returns. Actual after-tax returns depend on the investor’s tax situation and may differ from those shown, and after-tax returns are not relevant to investors who hold their Fund shares through tax deferred arrangements such as 401(k) plans or individual retirement accounts. After-tax returns may be higher than before-tax returns due to an assumed benefit from capital losses that would have been realized had Fund shares been sold at the end of the relevant periods, as applicable.
Performance Availability Website Address [Text] www.morganstanley.com/im
Performance Availability Phone [Text] 1-800-869-6397
(MSIF - Opportunity Portfolios) | Developing Opportunity Portfolio | Class I  
Prospectus [Line Items]  
Highest Quarterly Return, Label [Optional Text] High Quarter
Highest Quarterly Return 14.06%
Highest Quarterly Return, Date Sep. 30, 2024
Lowest Quarterly Return, Label [Optional Text] Low Quarter
Lowest Quarterly Return (18.91%)
Lowest Quarterly Return, Date Mar. 31, 2022
(MSIF - Opportunity Portfolios) | Global Opportunity Portfolio  
Prospectus [Line Items]  
Bar Chart and Performance Table [Heading] Performance Information
Performance Narrative [Text Block]
Pursuant to an agreement and plan of reorganization between the Company, on behalf of the Fund, and Van Kampen Equity Trust, on behalf of the Van Kampen Global Growth Fund (the “Predecessor Fund”), on May 21, 2010 the Fund acquired substantially all of the assets and substantially all of the liabilities of the Predecessor Fund in exchange for Class I and Class L shares of the Fund (the “Reorganization”). Pursuant to the Reorganization, Class C and Class I shareholders of the Predecessor Fund received Class L and Class I shares, respectively, of the Fund. As a result of the Reorganization, the Fund is the accounting successor of the Predecessor Fund. The historical performance information shown below reflects, for the period prior to the Reorganization, the historical performance of the Class C and Class I shares of the Predecessor Fund.
The bar chart and table below provide some indication of the risks of investing in the Fund by showing changes in the Fund’s Class I shares’ performance from year-to-year and by showing how the Fund’s average annual returns for the past one, five and ten year periods and since inception compare with those of a broad measure of market performance. The performance of the other classes, which is shown in the table below, will differ because the classes have different ongoing fees. The Fund’s returns in the table include the maximum applicable sales charge for Class A and Class C and assume you sold your shares at the end of each period (unless otherwise noted). The Fund’s past performance, before and after taxes, is not necessarily an indication of how the Fund will perform in the future. Updated performance information is available online at www.morganstanley.com/im or by calling toll-free 1-800-869-6397.
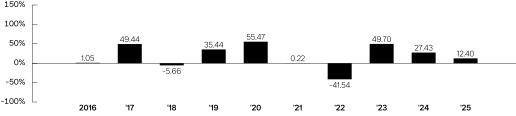
Performance Past Does Not Indicate Future [Text] The Fund’s past performance, before and after taxes, is not necessarily an indication of how the Fund will perform in the future.
Performance Information Illustrates Variability of Returns [Text] The bar chart and table below provide some indication of the risks of investing in the Fund by showing changes in the Fund’s Class I shares’ performance from year-to-year and by showing how the Fund’s average annual returns for the past one, five and ten year periods and since inception compare with those of a broad measure of market performance.
Bar Chart [Heading] Annual Total Returns —  Calendar Years
Bar Chart [Table]
image
Bar Chart Closing [Text Block]
High Quarter
06/30/20
31.66%
Low Quarter
06/30/22
-27.33%
Performance Table Heading Average Annual Total Returns(for the calendar periods ended  December 31, 2025)
Performance Table Does Reflect Sales Loads The Fund’s returns in the table include the maximum applicable sales charge for Class A and Class C and assume you sold your shares at the end of each period (unless otherwise noted).
Performance [Table]
 
Past
One Year
Past
Five Years
Past
Ten Years
Since Inception
Class I (commenced operations on 5/30/2008)1


Return Before Taxes
12.40%
4.67%
14.19%
12.78%
Return After Taxes on Distributions2
9.89%
2.50%
12.74%
11.58%
Return After Taxes on Distributions and Sale of Fund Shares
9.10%
3.14%
11.55%
10.72%
Class A (commenced operations on 5/21/2010)


Return Before Taxes
6.20%
3.25%
13.23%
14.83%
Class L (commenced operations on 5/30/2008)1


Return Before Taxes
11.96%
4.28%
13.76%
12.37%
Class C (commenced operations on 4/30/2015)


Return Before Taxes
10.32%
3.63%
13.21%
12.89%3
Class R6 (commenced operations on 9/13/2013)


Return Before Taxes
12.51%
4.76%
14.26%
15.37%
MSCI All Country World Net Index (reflects no deduction for fees, expenses or taxes)4
22.34%
11.19%
11.72%
7.67%5
[41],[42],[43],[44],[45]
Performance Table Closing [Text Block]
The after-tax returns shown in the table above are calculated using the historical highest individual federal marginal income tax rates during the period shown and do not reflect the impact of state and local taxes. After-tax returns for the Fund’s other classes will vary from Class I shares’ returns. Actual after-tax returns depend on the investor’s tax situation and may differ from those shown, and after-tax returns are not relevant to investors who hold their Fund shares through tax deferred arrangements such as 401(k) plans or individual retirement accounts. After-tax returns may be higher than before-tax returns due to an assumed benefit from capital losses that would have been realized had Fund shares been sold at the end of the relevant periods, as applicable.
Performance Availability Website Address [Text] www.morganstanley.com/im
Performance Availability Phone [Text] 1-800-869-6397
(MSIF - Opportunity Portfolios) | Global Opportunity Portfolio | Class I  
Prospectus [Line Items]  
Highest Quarterly Return, Label [Optional Text] High Quarter
Highest Quarterly Return 31.66%
Highest Quarterly Return, Date Jun. 30, 2020
Lowest Quarterly Return, Label [Optional Text] Low Quarter
Lowest Quarterly Return (27.33%)
Lowest Quarterly Return, Date Jun. 30, 2022
(MSIF - Opportunity Portfolios) | International Advantage Portfolio  
Prospectus [Line Items]  
Bar Chart and Performance Table [Heading] Performance Information
Performance Narrative [Text Block]
The bar chart and table below provide some indication of the risks of investing in the Fund by showing changes in the Fund’s Class I shares’ performance from year-to-year and by showing how the Fund’s average annual returns for the past one, five and ten year periods and since inception compare with those of a broad measure of   market performance. The performance of the other classes, which is shown in the table below, will differ because the classes have different ongoing fees. The Fund’s returns in the table include the maximum applicable sales charge for Class A and Class C and assume you sold your shares at the end of each period (unless otherwise noted). The Fund’s past performance, before and after taxes, is not necessarily an indication of how the Fund will perform in the future. Updated performance information is available online at www.morganstanley.com/im or by calling toll-free 1-800-869-6397.
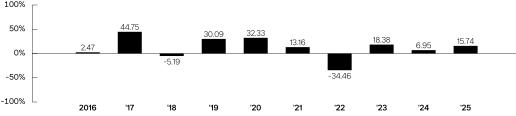
Performance Past Does Not Indicate Future [Text] The Fund’s past performance, before and after taxes, is not necessarily an indication of how the Fund will perform in the future.
Performance Information Illustrates Variability of Returns [Text] The bar chart and table below provide some indication of the risks of investing in the Fund by showing changes in the Fund’s Class I shares’ performance from year-to-year and by showing how the Fund’s average annual returns for the past one, five and ten year periods and since inception compare with those of a broad measure of   market performance.
Bar Chart [Heading] Annual Total Returns—Calendar Years
Bar Chart [Table]
image
Bar Chart Closing [Text Block]
High Quarter
06/30/20
19.40%
Low Quarter
06/30/22
-20.71%
Performance Table Heading Average Annual Total Returns(for the calendar periods ended  December 31, 2025)
Performance Table Does Reflect Sales Loads The Fund’s returns in the table include the maximum applicable sales charge for Class A and Class C and assume you sold your shares at the end of each period (unless otherwise noted).
Performance Table Uses Highest Federal Rate The after-tax returns shown in the table above are calculated using the historical highest individual federal marginal income tax rates during the period shown and do not reflect the impact of state and local taxes.
Performance Table Not Relevant to Tax Deferred Actual after-tax returns depend on the investor’s tax situation and may differ from those shown, and after-tax returns are not relevant to investors who hold their Fund shares through tax deferred arrangements such as 401(k) plans or individual retirement accounts.
Performance Table Explanation after Tax Higher After-tax returns may be higher than before-tax returns due to foreign tax credits and/or an assumed benefit from capital losses that would have been realized had Fund shares been sold at the end of the relevant periods, as applicable.
Performance [Table]
 
Past
One Year
Past
Five Years
Past
Ten Years
Since Inception
Class I (commenced operations on 12/28/2010)


Return Before Taxes
15.74%
1.68%
10.16%
9.69%
Return After Taxes on Distributions1
15.84%
1.50%
9.91%
9.09%
Return After Taxes on Distributions and Sale of Fund Shares
9.42%
1.32%
8.37%
7.97%
Class A (commenced operations on 12/28/2010)


Return Before Taxes
9.34%
0.30%
9.23%
8.98%
Class L (commenced operations on 12/28/2010)


Return Before Taxes
14.77%
0.81%
9.22%
8.78%
Class C (commenced operations on 4/30/2015)


Return Before Taxes
13.56%
0.66%
9.19%
8.36%2
Class R6 (commenced operations on 6/15/2018)


Return Before Taxes
15.85%
1.78%
N/A
6.40%
MSCI All Country World ex USA Net Index (reflects no deduction for fees, expenses or taxes)3
32.39%
7.91%
8.41%
5.98%4
[46],[47],[48],[49]
Performance Table One Class of after Tax Shown [Text] After-tax returns for the Fund’s other classes will vary from Class I shares’ returns.
Performance Table Closing [Text Block]
The after-tax returns shown in the table above are calculated using the historical highest individual federal marginal income tax rates during the period shown and do not reflect the impact of state and local taxes. After-tax returns for the Fund’s other classes will vary from Class I shares’ returns. Actual after-tax returns depend on the investor’s tax situation and may differ from those shown, and after-tax returns are not relevant to investors who hold their Fund shares through tax deferred arrangements such as 401(k) plans or individual retirement accounts. After-tax returns may be higher than before-tax returns due to foreign tax credits and/or an assumed benefit from capital losses that would have been realized had Fund shares been sold at the end of the relevant periods, as applicable.
Performance Availability Website Address [Text] www.morganstanley.com/im
Performance Availability Phone [Text] 1-800-869-6397
(MSIF - Opportunity Portfolios) | International Advantage Portfolio | Class I  
Prospectus [Line Items]  
Highest Quarterly Return, Label [Optional Text] High Quarter
Highest Quarterly Return 19.40%
Highest Quarterly Return, Date Jun. 30, 2020
Lowest Quarterly Return, Label [Optional Text] Low Quarter
Lowest Quarterly Return (20.71%)
Lowest Quarterly Return, Date Jun. 30, 2022
(MSIF - Opportunity Portfolios) | International Opportunity Portfolio  
Prospectus [Line Items]  
Bar Chart and Performance Table [Heading] Performance Information
Performance Narrative [Text Block]
The bar chart and table below provide some indication of the risks of investing in the Fund by showing changes in the Fund’s Class I shares’ performance from year-to-year and by showing how the Fund’s average annual returns for the past one, five and ten year periods and since inception compare with those of a broad measure of   market performance. The performance of the other classes, which is shown in the table below, will differ because the classes have different ongoing fees. The Fund’s returns in the table include the maximum applicable sales charge for Class A and Class C and assume you sold your shares at the end of each period (unless otherwise noted). The Fund’s past performance, before and after taxes, is not necessarily an indication of how the Fund will perform in the future. Updated performance information is available online at www.morganstanley.com/im or by calling toll-free 1-800-869-6397.
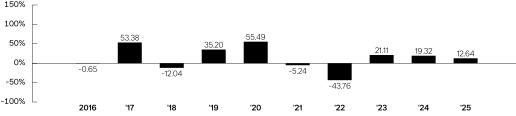
Performance Past Does Not Indicate Future [Text] The Fund’s past performance, before and after taxes, is not necessarily an indication of how the Fund will perform in the future.
Performance Information Illustrates Variability of Returns [Text] The bar chart and table below provide some indication of the risks of investing in the Fund by showing changes in the Fund’s Class I shares’ performance from year-to-year and by showing how the Fund’s average annual returns for the past one, five and ten year periods and since inception compare with those of a broad measure of   market performance.
Bar Chart [Heading] Annual Total Returns—Calendar Years
Bar Chart [Table]
image
Bar Chart Closing [Text Block]
High Quarter
06/30/20
34.02%
Low Quarter
03/31/22
-26.33%
Performance Table Heading Average Annual Total Returns(for the calendar periods ended  December 31, 2025)
Performance Table Does Reflect Sales Loads The Fund’s returns in the table include the maximum applicable sales charge for Class A and Class C and assume you sold your shares at the end of each period (unless otherwise noted).
Performance Table Uses Highest Federal Rate The after-tax returns shown in the table above are calculated using the historical highest individual federal marginal income tax rates during the period shown and do not reflect the impact of state and local taxes.
Performance Table Not Relevant to Tax Deferred Actual after-tax returns depend on the investor’s tax situation and may differ from those shown, and after-tax returns are not relevant to investors who hold their Fund shares through tax deferred arrangements such as 401(k) plans or individual retirement accounts.
Performance Table Explanation after Tax Higher After-tax returns may be higher than before-tax returns due to an assumed benefit from capital losses that would have been realized had Fund shares been sold at the end of the relevant periods, as applicable.
Performance [Table]
 
Past
One Year
Past
Five Years
Past
Ten Years
Since
Inception
Class I (commenced operations on 3/31/2010)
 
Return Before Taxes
12.64%
-2.80%
9.35%
9.58%
Return After Taxes on Distributions1
12.75%
-3.22%
9.07%
9.20%
Return After Taxes on Distributions and Sale of Fund Shares
7.59%
-2.13%
7.68%
8.07%
Class A (commenced operations on 3/31/2010)
 
Return Before Taxes
6.40%
-4.15%
8.42%
8.87%
Class L (commenced operations on 3/31/2010)
 
Return Before Taxes
11.72%
-3.63%
8.42%
8.67%
Class C (commenced operations on 4/30/2015)
 
Return Before Taxes
10.46%
-3.82%
8.37%
7.69%2
Class R6  (commenced operations on 9/13/2013)
 
Return Before Taxes
12.71%
-2.73%
9.41%
9.74%
MSCI All Country World ex USA Net Index (reflects no deduction for fees, expenses or taxes)3
32.39%
7.91%
8.41%
6.22%4
[50],[51],[52],[53]
Performance Table One Class of after Tax Shown [Text] After-tax returns for the Fund’s other classes will vary from Class I shares’ returns.
Performance Table Closing [Text Block]
The after-tax returns shown in the table above are calculated using the historical highest individual federal marginal income tax rates during the period shown and do not reflect the impact of state and local taxes. After-tax returns for the Fund’s other classes will vary from Class I shares’ returns. Actual after-tax returns depend on the investor’s tax situation and may differ from those shown, and after-tax returns are not relevant to investors who hold their Fund shares through tax deferred arrangements such as 401(k) plans or individual retirement accounts. After-tax returns may be higher than before-tax returns due to an assumed benefit from capital losses that would have been realized had Fund shares been sold at the end of the relevant periods, as applicable.
Performance Availability Website Address [Text] www.morganstanley.com/im
Performance Availability Phone [Text] 1-800-869-6397
(MSIF - Opportunity Portfolios) | International Opportunity Portfolio | Class I  
Prospectus [Line Items]  
Highest Quarterly Return, Label [Optional Text] High Quarter
Highest Quarterly Return 34.02%
Highest Quarterly Return, Date Jun. 30, 2020
Lowest Quarterly Return, Label [Optional Text] Low Quarter
Lowest Quarterly Return (26.33%)
Lowest Quarterly Return, Date Mar. 31, 2022
(MSIF - Applied Equity Portfolios) | Global Concentrated Portfolio  
Prospectus [Line Items]  
Bar Chart and Performance Table [Heading] Performance Information
Performance Narrative [Text Block]
The bar chart and table below provide some indication of the risks of investing in the Fund by showing changes in the Fund’s Class I shares’ performance from year-to-year and by showing how the Fund’s average annual returns for the past one and five year periods and since inception compare with those of a broad measure of market performance. The performance of the other classes, which is shown in the table below, will differ because the classes have different ongoing fees. The Fund’s returns in the table include the maximum applicable sales charge for Class A and Class  C and assume you sold your shares at
the end of each period (unless otherwise noted). The Fund’s past performance, before and after taxes, is not necessarily an indication of how the Fund will perform in the future. Updated performance information is available online at  www.morganstanley.com/im or by calling toll-free (800)-869-6397.
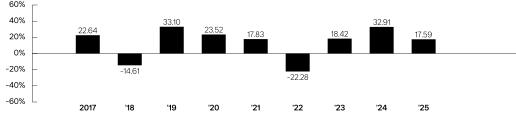
Performance Past Does Not Indicate Future [Text] The Fund’s past performance, before and after taxes, is not necessarily an indication of how the Fund will perform in the future.
Performance Information Illustrates Variability of Returns [Text] The bar chart and table below provide some indication of the risks of investing in the Fund by showing changes in the Fund’s Class I shares’ performance from year-to-year and by showing how the Fund’s average annual returns for the past one and five year periods and since inception compare with those of a broad measure of market performance.
Bar Chart [Table]
image
Bar Chart Closing [Text Block]
High Quarter
03/31/24
22.24%
Low Quarter
03/31/20
-21.14%
Performance Table Heading Average Annual Total Returns(for the calendar periods ended  December 31, 2025)
Performance Table Does Reflect Sales Loads The performance of the other classes, which is shown in the table below, will differ because the classes have different ongoing fees. The Fund’s returns in the table include the maximum applicable sales charge for Class A and Class  C and assume you sold your shares at the end of each period (unless otherwise noted).
Performance Table Uses Highest Federal Rate The after-tax returns shown in the table above are calculated using the historical highest individual federal marginal income tax rates during the period shown and do not reflect the impact of state and local taxes.
Performance Table Not Relevant to Tax Deferred Actual after-tax returns depend on the investor’s tax situation and may differ from those shown, and after-tax returns are not relevant to investors who hold their Fund shares through tax deferred arrangements such as 401(k) plans or individual retirement accounts.
Performance Table Explanation after Tax Higher After-tax returns may be higher than before-tax returns due to an assumed benefit from capital losses that would have been realized had Fund shares been sold at the end of the relevant periods, as applicable.
Performance [Table]
 
Past
One Year
Past
Five Years
Since Inception
Class I (commenced operations on 5/27/2016)
 
 
Return Before Taxes
17.59%
11.13%
12.06%
Return After Taxes on Distributions1
17.07%
10.76%
11.80%
Return After Taxes on Distributions and Sale of Fund Shares
10.78%
8.79%
9.99%
Class A (commenced operations on 5/27/2016)
 
 
Return Before Taxes
11.13%
9.61%
11.08%
Class C (commenced operations on 5/27/2016)
 
 
Return Before Taxes
15.36%
9.96%
11.01%
Class R6 (commenced operations on 5/27/2016)
 
 
Return Before Taxes
17.66%
11.17%
12.12%
MSCI World Net Index (reflects no deduction for fees, expenses or taxes)2
21.09%
12.15%
12.49%3
[54],[55],[56]
Performance Table One Class of after Tax Shown [Text] After-tax returns for the Fund’s other classes will vary from Class I shares’ returns.
Performance Table Closing [Text Block]
The after-tax returns shown in the table above are calculated using the historical highest individual federal marginal income tax rates during the period shown and do not reflect the impact of state and local taxes. After-tax returns for the Fund’s other classes will vary from Class I shares’ returns. Actual after-tax returns depend on the investor’s tax situation and may differ from those shown, and after-tax returns are not relevant to investors who hold their Fund shares through tax deferred arrangements such as 401(k) plans or individual retirement accounts. After-tax returns may be higher than before-tax returns due to an assumed benefit from capital losses that would have been realized had Fund shares been sold at the end of the relevant periods, as applicable.
Performance Availability Website Address [Text] www.morganstanley.com/im
Performance Availability Phone [Text] (800)-869-6397
(MSIF - Applied Equity Portfolios) | Global Concentrated Portfolio | Class I  
Prospectus [Line Items]  
Highest Quarterly Return, Label [Optional Text] High Quarter
Highest Quarterly Return 22.24%
Highest Quarterly Return, Date Mar. 31, 2024
Lowest Quarterly Return, Label [Optional Text] Low Quarter
Lowest Quarterly Return (21.14%)
Lowest Quarterly Return, Date Mar. 31, 2020
(MSIF - Applied Equity Portfolios) | Global Core Portfolio  
Prospectus [Line Items]  
Bar Chart and Performance Table [Heading] Performance Information
Performance Narrative [Text Block]
The bar chart and table below provide some indication of the risks of investing in the Fund by showing changes in the Fund’s Class I shares’ performance from year-to-year and by showing how the Fund’s average annual returns for the past one and five year periods and since inception compare with those of a broad measure of market performance. The performance of the other classes, which is shown in the table below, will differ because the classes have different ongoing fees. The Fund’s returns in the table include the maximum applicable sales charge for Class A and Class  C and assume you sold your shares at the end of each period (unless otherwise noted). The Fund’s past performance, before and after taxes, is not necessarily an
indication of how the Fund will perform in the future. Updated performance information is available online at  www.morganstanley.com/im or by calling toll-free (800)-869-6397.
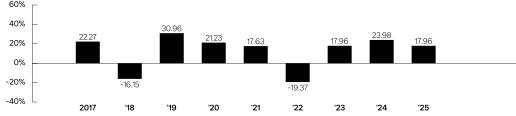
Performance Past Does Not Indicate Future [Text] The Fund’s past performance, before and after taxes, is not necessarily an indication of how the Fund will perform in the future.
Performance Information Illustrates Variability of Returns [Text] The bar chart and table below provide some indication of the risks of investing in the Fund by showing changes in the Fund’s Class I shares’ performance from year-to-year and by showing how the Fund’s average annual returns for the past one and five year periods and since inception compare with those of a broad measure of market performance.
Bar Chart [Heading] Annual Total Returns—Calendar Years
Bar Chart [Table]
image
Bar Chart Closing [Text Block]
High Quarter
06/30/20
22.29%
Low Quarter
03/31/20
-22.44%
Performance Table Heading Average Annual Total Returns(for the calendar periods ended  December 31, 2025)
Performance Table Does Reflect Sales Loads The performance of the other classes, which is shown in the table below, will differ because the classes have different ongoing fees. The Fund’s returns in the table include the maximum applicable sales charge for Class A and Class  C and assume you sold your shares at the end of each period (unless otherwise noted).
Performance Table Uses Highest Federal Rate The after-tax returns shown in the table above are calculated using the historical highest individual federal marginal income tax rates during the period shown and do not reflect the impact of state and local taxes.
Performance Table Not Relevant to Tax Deferred Actual after-tax returns depend on the investor’s tax situation and may differ from those shown, and after-tax returns are not relevant to investors who hold their Fund shares through tax deferred arrangements such as 401(k) plans or individual retirement accounts.
Performance Table Explanation after Tax Higher After-tax returns may be higher than before-tax returns due to an assumed benefit from capital losses that would have been realized had Fund shares been sold at the end of the relevant periods, as applicable.
Performance [Table]
 
Past
One Year
Past
Five Years
Since Inception
Class I (commenced operations on 5/27/2016)
 
 
Return Before Taxes
17.96%
10.35%
10.87%
Return After Taxes on Distributions1
17.31%
9.94%
10.58%
Return After Taxes on Distributions and Sale of Fund Shares
11.08%
8.15%
8.93%
Class A (commenced operations on 5/27/2016)
 
 
Return Before Taxes
11.42%
8.80%
9.86%
Class C (commenced operations on 5/27/2016)
 
 
Return Before Taxes
15.62%
9.13%
9.79%
Class R6 (commenced operations on 5/27/2016)
 
 
Return Before Taxes
18.04%
10.39%
10.91%
MSCI World Net Index (reflects no deductions for fees, expenses or taxes2
21.09%
12.15%
12.49%3
[57],[58],[59]
Performance Table One Class of after Tax Shown [Text] After-tax returns for the Fund’s other classes will vary from Class I shares’ returns.
Performance Table Closing [Text Block]
The after-tax returns shown in the table above are calculated using the historical highest individual federal marginal income tax rates during the period shown and do not reflect the impact of state and local taxes. After-tax returns for the Fund’s other classes will vary from Class I shares’ returns. Actual after-tax returns depend on the investor’s tax situation and may differ from those shown, and after-tax returns are not relevant to investors who hold their Fund shares through tax deferred arrangements such as 401(k) plans or individual retirement accounts. After-tax returns may be higher than before-tax returns due to an assumed benefit from capital losses that would have been realized had Fund shares been sold at the end of the relevant periods, as applicable.
Performance Availability Website Address [Text] www.morganstanley.com/im
Performance Availability Phone [Text] (800)-869-6397
(MSIF - Applied Equity Portfolios) | Global Core Portfolio | Class I  
Prospectus [Line Items]  
Highest Quarterly Return, Label [Optional Text] High Quarter
Highest Quarterly Return 22.29%
Highest Quarterly Return, Date Jun. 30, 2020
Lowest Quarterly Return, Label [Optional Text] Low Quarter
Lowest Quarterly Return (22.44%)
Lowest Quarterly Return, Date Mar. 31, 2020
(MSIF - Applied Equity Portfolios) | US Core Portfolio  
Prospectus [Line Items]  
Bar Chart and Performance Table [Heading] Performance Information
Performance Narrative [Text Block]
The bar chart and table below provide some indication of the risks of investing in the Fund by showing changes in the Fund’s Class I shares’ performance from year-to-year and by showing how the Fund’s average annual returns for the past one and five year periods and since inception compare with those of a broad measure of market performance. The performance of the other classes, which is shown in the table below, will differ because the classes have different ongoing fees. The Fund’s returns in the table include the maximum applicable sales charge for Class A and Class  C and assume you sold your shares at the end of each period (unless otherwise noted). The Fund’s past performance, before and after taxes, is not necessarily an indication of how the Fund will perform in the future. Updated performance information is available online at  www.morganstanley.com/im or by calling toll-free (800)-869-6397.
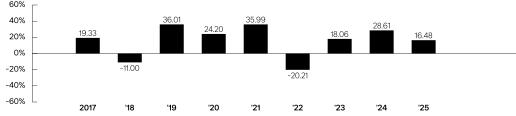
Performance Past Does Not Indicate Future [Text] The Fund’s past performance, before and after taxes, is not necessarily an indication of how the Fund will perform in the future.
Performance Information Illustrates Variability of Returns [Text] The bar chart and table below provide some indication of the risks of investing in the Fund by showing changes in the Fund’s Class I shares’ performance from year-to-year and by showing how the Fund’s average annual returns for the past one and five year periods and since inception compare with those of a broad measure of market performance.
Bar Chart [Heading] Annual Total Returns—Calendar Years
Bar Chart [Table]
image
Bar Chart Closing [Text Block]
High Quarter
06/30/20
26.23%
Low Quarter
03/31/20
-22.25%
Performance Table Heading Average Annual Total Returns(for the calendar periods ended  December 31, 2025)
Performance Table Does Reflect Sales Loads The performance of the other classes, which is shown in the table below, will differ because the classes have different ongoing fees. The Fund’s returns in the table include the maximum applicable sales charge for Class A and Class  C and assume you sold your shares at the end of each period (unless otherwise noted).
Performance Table Uses Highest Federal Rate The after-tax returns shown in the table above are calculated using the historical highest individual federal marginal income tax rates during the period shown and do not reflect the impact of state and local taxes.
Performance Table Not Relevant to Tax Deferred Actual after-tax returns depend on the investor’s tax situation and may differ from those shown, and after-tax returns are not relevant to investors who hold their Fund shares through tax deferred arrangements such as 401(k) plans or individual retirement accounts.
Performance Table Explanation after Tax Higher After-tax returns may be higher than before-tax returns due to an assumed benefit from capital losses that would have been realized had Fund shares been sold at the end of the relevant periods, as applicable.
Performance [Table]
 
Past
One Year
Past
Five Years
Since
Inception
Class I (commenced operations on 5/27/2016)
 
Return Before Taxes
16.48%
13.93%
14.39%
Return After Taxes on Distributions1
16.48%
13.89%
14.24%
Return After Taxes on Distributions and Sale of Fund Shares
9.76%
11.19%
12.07%
 
Past
One Year
Past
Five Years
Since
Inception
Class A (commenced operations on 5/27/2016)
 
Return Before Taxes
10.04%
12.37%
13.38%
Class C (commenced operations on 5/27/2016)
 
Return Before Taxes
14.26%
12.74%
13.31%
Class R6 (commenced operations on 5/27/2016)
 
Return Before Taxes
16.54%
13.97%
14.43%
S&P 500® Index (reflects no deduction for fees, expenses or taxes)2
17.88%
14.42%
15.06%3
[60],[61],[62]
Performance Table One Class of after Tax Shown [Text] After-tax returns for the Fund’s other classes will vary from Class I shares’ returns.
Performance Table Closing [Text Block]
The after-tax returns shown in the table above are calculated using the historical highest individual federal marginal income tax rates during the period shown and do not reflect the impact of state and local taxes. After-tax returns for the Fund’s other classes will vary from Class I shares’ returns. Actual after-tax returns depend on the investor’s tax situation and may differ from those shown, and after-tax returns are not relevant to investors who hold their Fund shares through tax deferred arrangements such as 401(k) plans or individual retirement accounts. After-tax returns may be higher than before-tax returns due to an assumed benefit from capital losses that would have been realized had Fund shares been sold at the end of the relevant periods, as applicable.
Performance Availability Website Address [Text] www.morganstanley.com/im
Performance Availability Phone [Text] (800)-869-6397
(MSIF - Applied Equity Portfolios) | US Core Portfolio | Class I  
Prospectus [Line Items]  
Highest Quarterly Return, Label [Optional Text] High Quarter
Highest Quarterly Return 26.23%
Highest Quarterly Return, Date Jun. 30, 2020
Lowest Quarterly Return, Label [Optional Text] Low Quarter
Lowest Quarterly Return (22.25%)
Lowest Quarterly Return, Date Mar. 31, 2020
(MSIF - Growth Portfolio - Class IR) | Growth Portfolio  
Prospectus [Line Items]  
Bar Chart and Performance Table [Heading] Performance Information
Performance Narrative [Text Block]
The bar chart and table below provide some indication of the risks of investing in the Fund by showing changes in the Fund’s Class IR shares’ performance from year-to-year and by showing how the Fund’s average annual returns for the past one and five year periods and since inception compare with those of a broad measure of market performance and one or more additional indexes. The additional index(es) in the table provides a means to compare the Fund’s average annual total returns to a benchmark that the Adviser believes is representative of the Fund’s investment universe. The Fund’s past performance, before and after taxes, is not necessarily an indication of how the Fund will perform in the future. Updated performance information is available online at  www.morganstanley.com/im or by calling toll-free 1-800-869-6397.
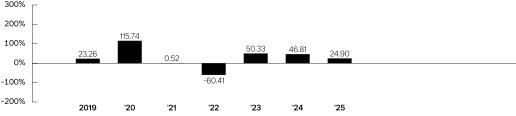
Performance Past Does Not Indicate Future [Text] The Fund’s past performance, before and after taxes, is not necessarily an indication of how the Fund will perform in the future.
Performance Information Illustrates Variability of Returns [Text] The bar chart and table below provide some indication of the risks of investing in the Fund by showing changes in the Fund’s Class IR shares’ performance from year-to-year and by showing how the Fund’s average annual returns for the past one and five year periods and since inception compare with those of a broad measure of market performance and one or more additional indexes.
Bar Chart [Heading] Annual Total Returns—Calendar Years
Bar Chart [Table]
image
Bar Chart Closing [Text Block]
High Quarter
06/30/20
58.33%
Low Quarter
06/30/22
-41.18%
Performance Table Heading Average Annual Total Returns(for the calendar periods ended  December 31, 2025)
Performance [Table]
 
Past
One Year
Past
Five Years
Since
Inception
Class IR (commenced operations on 6/15/2018)
 
Return Before Taxes
24.90%
1.87%
13.06%
Return After Taxes on Distributions1
24.90%
0.11%
10.80%
Return After Taxes on Distributions and Sale of Fund Shares
14.74%
0.95%
9.96%
Russell 1000® Index (reflects no deduction for fees, expenses or taxes)2
17.37%
13.59%
14.19%3
Russell 1000® Growth Index (reflects no deduction for fees, expenses or taxes)4
18.56%
15.32%
17.79%3
[63],[64],[65],[66]
Performance Table Closing [Text Block]
The after-tax returns shown in the table above are calculated using the historical highest individual federal marginal income tax rates during the period shown and do not reflect the impact of state and local taxes. After-tax returns for the Fund’s other classes  will vary from Class IR shares’ returns. Actual after-tax returns depend on the investor’s tax situation and may differ from those shown, and after-tax returns are not relevant to investors who hold their Fund shares through tax deferred arrangements such as 401(k) plans or individual retirement accounts. After-tax returns may be higher than before-tax returns due to an assumed benefit from capital losses that would have been realized had Fund shares been sold at the end of the relevant periods, as applicable.
Performance Availability Website Address [Text] www.morganstanley.com/im
Performance Availability Phone [Text] 1-800-869-6397
(MSIF - Growth Portfolio - Class IR) | Growth Portfolio | Class IR  
Prospectus [Line Items]  
Highest Quarterly Return, Label [Optional Text] High Quarter
Highest Quarterly Return 58.33%
Highest Quarterly Return, Date Jun. 30, 2020
Lowest Quarterly Return, Label [Optional Text] Low Quarter
Lowest Quarterly Return (41.18%)
Lowest Quarterly Return, Date Jun. 30, 2022
(MSIF - Opportunity Portfolios - Class IR) | Global Opportunity Portfolio  
Prospectus [Line Items]  
Bar Chart and Performance Table [Heading] Performance Information
Performance Narrative [Text Block]
The bar chart and table below provide some indication of the  risks of investing in the Fund by showing changes in the Fund’s  Class IR shares’ performance from year-to-year and by showing how the Fund’s average annual returns for the past one and five year periods and since inception compare with those of a broad measure of market performance. The Fund’s past performance, before and after taxes, is not necessarily an indication of how  the Fund will perform in the future. Updated performance  information is available online at www.morganstanley.com/im  or by calling toll-free 1-800-869-6397.
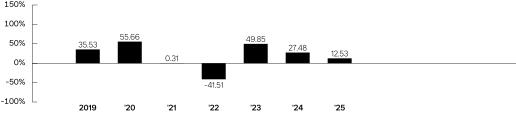
Performance Past Does Not Indicate Future [Text] The Fund’s past performance, before and after taxes, is not necessarily an indication of how  the Fund will perform in the future.
Performance Information Illustrates Variability of Returns [Text] The bar chart and table below provide some indication of the  risks of investing in the Fund by showing changes in the Fund’s  Class IR shares’ performance from year-to-year and by showing how the Fund’s average annual returns for the past one and five year periods and since inception compare with those of a broad measure of market performance.
Bar Chart [Heading] Annual Total Returns—Calendar Years
Bar Chart [Table]
image
Bar Chart Closing [Text Block]
High Quarter
06/30/20
31.69%
Low Quarter
06/30/22
-27.31%
Performance Table Heading Average Annual Total Returns(for the calendar periods ended  December 31, 2025)
Performance Table Uses Highest Federal Rate The after-tax returns shown in the table above are calculated using the historical highest individual federal marginal income tax rates during the period shown and do not reflect the impact of state and local taxes.
Performance Table Not Relevant to Tax Deferred Actual after-tax returns depend on the investor’s tax situation and may differ from those shown, and after-tax returns are not relevant to investors who hold their Fund shares through tax deferred arrangements such as 401(k) plans or individual retirement accounts.
Performance Table Explanation after Tax Higher After-tax returns may be higher than before-tax returns due to an assumed benefit from capital losses that would have been realized had Fund shares been sold at the end of the relevant periods, as applicable.
Performance [Table]
 
Past
One Year
Past
Five Years
Since
Inception
Class IR  (commenced operations on 6/15/2018)
 
Return Before Taxes
12.53%
4.75%
10.78%
Return After Taxes on Distributions1
10.04%
2.60%
9.19%
Return After Taxes on Distributions and Sale of Fund Shares
9.16%
3.20%
8.38%
MSCI All Country World Net Index (reflects no deduction for fees, expenses or taxes)2
22.34%
11.19%
11.18%3
[67],[68],[69]
Performance Table One Class of after Tax Shown [Text] After-tax returns for the Fund’s other classes  will vary from Class IR shares’ returns.
Performance Table Closing [Text Block]
The after-tax returns shown in the table above are calculated using the historical highest individual federal marginal income tax rates during the period shown and do not reflect the impact of state and local taxes. After-tax returns for the Fund’s other classes  will vary from Class IR shares’ returns. Actual after-tax returns depend on the investor’s tax situation and may differ from those shown, and after-tax returns are not relevant to investors who hold their Fund shares through tax deferred arrangements such as 401(k) plans or individual retirement accounts. After-tax returns may be higher than before-tax returns due to an assumed benefit from capital losses that would have been realized had Fund shares been sold at the end of the relevant periods, as applicable.
Performance Availability Website Address [Text] www.morganstanley.com/im
Performance Availability Phone [Text] 1-800-869-6397
(MSIF - Opportunity Portfolios - Class IR) | Global Opportunity Portfolio | Class IR  
Prospectus [Line Items]  
Highest Quarterly Return, Label [Optional Text] High Quarter
Highest Quarterly Return 31.69%
Highest Quarterly Return, Date Jun. 30, 2020
Lowest Quarterly Return, Label [Optional Text] Low Quarter
Lowest Quarterly Return (27.31%)
Lowest Quarterly Return, Date Jun. 30, 2022
(MSIF - Opportunity Portfolios - Class IR) | International Opportunity Portfolio  
Prospectus [Line Items]  
Bar Chart and Performance Table [Heading] Performance Information
Performance Narrative [Text Block]
The bar chart and table below provide some indication of the  risks of investing in the Fund by showing changes in the Fund’s  Class IR shares’ performance from year-to-year and by showing how the Fund’s average annual returns for the past one and five year periods and since inception compare with those of a broad measure of market performance. The Fund’s past performance, before and after taxes, is not necessarily an indication of how  the Fund will perform in the future. Updated performance  information is available online at www.morganstanley.com/im  or by calling toll-free 1-800-869-6397.
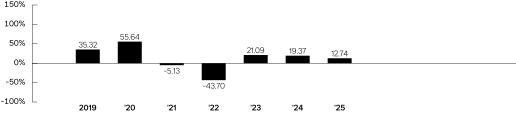
Performance Past Does Not Indicate Future [Text] The Fund’s past performance, before and after taxes, is not necessarily an indication of how  the Fund will perform in the future.
Performance Information Illustrates Variability of Returns [Text] The bar chart and table below provide some indication of the  risks of investing in the Fund by showing changes in the Fund’s  Class IR shares’ performance from year-to-year and by showing how the Fund’s average annual returns for the past one and five year periods and since inception compare with those of a broad measure of market performance.
Bar Chart [Heading] Annual Total Returns—Calendar Years
Bar Chart [Table]
image
Bar Chart Closing [Text Block]
High Quarter
06/30/20
34.04%
Low Quarter
03/31/22
-26.32%
Performance Table Heading Average Annual Total Returns(for the calendar periods ended  December 31, 2025)
Performance Table Uses Highest Federal Rate The after-tax returns shown in the table above are calculated using the historical highest individual federal marginal income tax rates during the period shown and do not reflect the impact of state and local taxes.
Performance Table Not Relevant to Tax Deferred Actual after-tax returns depend on the investor’s tax situation and may differ from those shown, and after-tax returns are not relevant to investors who hold their Fund shares through tax deferred arrangements such as 401(k) plans or individual retirement accounts.
Performance Table Explanation after Tax Higher After-tax returns may be higher than before-tax returns due to an assumed benefit from capital losses that would have been realized had Fund shares been sold at the end of the relevant periods, as applicable.
Performance [Table]
 
Past
One Year
Past
Five Years
Since
Inception
Class IR  (commenced operations on 6/15/2018)
 
Return Before Taxes
12.74%
-2.74%
4.88%
Return After Taxes on Distributions1
12.86%
-3.15%
4.57%
Return After Taxes on Distributions and Sale of Fund Shares
7.66%
-2.08%
3.83%
MSCI All Country World ex USA Net Index (reflects no deduction for fees, expenses or taxes)2
32.39%
7.91%
7.40%3
[70],[71],[72]
Performance Table One Class of after Tax Shown [Text] After-tax returns for the Fund’s other classes  will vary from Class IR shares’ returns.
Performance Table Closing [Text Block]
The after-tax returns shown in the table above are calculated using the historical highest individual federal marginal income tax rates during the period shown and do not reflect the impact of state and local taxes. After-tax returns for the Fund’s other classes  will vary from Class IR shares’ returns. Actual after-tax returns depend on the investor’s tax situation and may differ from those shown, and after-tax returns are not relevant to investors who hold their Fund shares through tax deferred arrangements such as 401(k) plans or individual retirement accounts. After-tax returns may be higher than before-tax returns due to an assumed benefit from capital losses that would have been realized had Fund shares been sold at the end of the relevant periods, as applicable.
Performance Availability Website Address [Text] www.morganstanley.com/im
Performance Availability Phone [Text] 1-800-869-6397
(MSIF - Opportunity Portfolios - Class IR) | International Opportunity Portfolio | Class IR  
Prospectus [Line Items]  
Highest Quarterly Return, Label [Optional Text] High Quarter
Highest Quarterly Return 34.04%
Highest Quarterly Return, Date Jun. 30, 2020
Lowest Quarterly Return, Label [Optional Text] Low Quarter
Lowest Quarterly Return (26.32%)
Lowest Quarterly Return, Date Mar. 31, 2022
(MSIF - Emerging Markets Equity Portfolios - Classes I, A, L, C and R6) | Passport Overseas Equity Portfolio  
Prospectus [Line Items]  
Bar Chart and Performance Table [Heading] Performance Information
Performance Narrative [Text Block]
The bar chart and table below provide some indication of the risks of investing in the Fund by showing changes in the Fund’s Class I shares’ performance from year-to-year and by showing how the Fund’s average annual returns for the past one, five and 10 year periods and since inception compare with those of a  broad measure of market performance and a custom benchmark. The performance of the other classes, which is shown in the table below, will differ because the classes have different ongoing fees. The Fund’s returns in the table include the maximum applicable sales charge for Class A and Class C and assume you sold your shares at the end of each period (unless otherwise noted). The Fund’s past performance, before and after taxes, is not necessarily an indication of how the Fund will perform in the future. Updated performance information is available online at www.morganstanley.com/im or by calling toll-free 1-800-869-6397.  
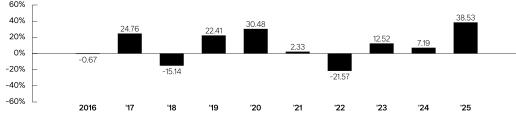
Performance Past Does Not Indicate Future [Text] The Fund’s past performance, before and after taxes, is not necessarily an indication of how the Fund will perform in the future.
Performance Information Illustrates Variability of Returns [Text] The bar chart and table below provide some indication of the risks of investing in the Fund by showing changes in the Fund’s Class I shares’ performance from year-to-year and by showing how the Fund’s average annual returns for the past one, five and 10 year periods and since inception compare with those of a  broad measure of market performance and a custom benchmark.
Bar Chart [Heading] Annual Total Returns —  Calendar Years
Bar Chart [Table]
image
Bar Chart Closing [Text Block]
High Quarter
06/30/20
22.22%
Low Quarter
03/31/20
-21.66%
Performance Table Heading Average Annual Total Returns(for the calendar periods ended  December 31, 2025)
Performance Table Does Reflect Sales Loads The Fund’s returns in the table include the maximum applicable sales charge for Class A and Class C and assume you sold your shares at the end of each period (unless otherwise noted).
Performance Table Uses Highest Federal Rate The after-tax returns shown in the table above are calculated using the historical highest individual federal marginal income tax rates during the period shown and do not reflect the impact of state and local taxes.
Performance Table Not Relevant to Tax Deferred Actual after-tax returns depend on the investor’s tax situation and may differ from those shown, and after-tax returns are not relevant to investors who hold their Fund shares through tax deferred arrangements such as 401(k) plans or individual retirement accounts.
Performance Table Explanation after Tax Higher After-tax returns may be higher than before-tax returns due to an assumed benefit from capital losses that would have been realized had Fund shares been sold at the end of the relevant periods, as applicable.
Performance [Table]
 
Past
One Year
Past
Five Years
Past
Ten Years
Since
Inception
Class I (commenced operations on 1/17/1992)


Return Before Taxes
38.53%
6.04%
8.46%
6.46%
Return After Taxes on Distributions1
34.78%
4.75%
7.67%
5.32%
Return After Taxes on Distributions and Sale of Fund Shares
25.73%
4.66%
6.87%
5.05%
Class A (commenced operations on 1/2/1996)


Return Before Taxes
30.80%
4.58%
7.53%
5.71%
Class L (commenced operations on 6/14/2012)


Return Before Taxes
37.39%
5.14%
7.53%
7.54%
Class C (commenced operations on 4/30/2015)


Return Before Taxes
36.02%
4.88%
7.43%
5.84%2
Class R6 (commenced operations on 10/31/2019)


Return Before Taxes
38.54%
6.11%
N/A
10.79%
MSCI All Country World ex USA Index (reflects no deduction for fees, expenses or taxes)3
32.39%
7.91%
8.41%
6.28%4
Active International Allocation Blend Index (reflects no deduction for fees, expenses or taxes)5
32.39%
7.91%
8.05%
6.13%4
[73],[74],[75],[76],[77]
Performance Table One Class of after Tax Shown [Text] After-tax returns for the Fund’s other classes will vary from Class I shares’ returns.
Performance Table Closing [Text Block]
The after-tax returns shown in the table above are calculated using the historical highest individual federal marginal income tax rates during the period shown and do not reflect the impact of state and local taxes. After-tax returns for the Fund’s other classes will vary from Class I shares’ returns. Actual after-tax returns depend on the investor’s tax situation and may differ from those shown, and after-tax returns are not relevant to investors who hold their Fund shares through tax deferred arrangements such as 401(k) plans or individual retirement accounts. After-tax returns may be higher than before-tax returns due to an assumed benefit from capital losses that would have been realized had Fund shares been sold at the end of the relevant periods, as applicable.
Performance Availability Website Address [Text] www.morganstanley.com/im
Performance Availability Phone [Text] 1-800-869-6397
(MSIF - Emerging Markets Equity Portfolios - Classes I, A, L, C and R6) | Passport Overseas Equity Portfolio | Class I  
Prospectus [Line Items]  
Highest Quarterly Return, Label [Optional Text] High Quarter
Highest Quarterly Return 22.22%
Highest Quarterly Return, Date Jun. 30, 2020
Lowest Quarterly Return, Label [Optional Text] Low Quarter
Lowest Quarterly Return (21.66%)
Lowest Quarterly Return, Date Mar. 31, 2020
(MSIF - Emerging Markets Equity Portfolios - Classes I, A, L, C and R6) | Emerging Markets Leaders Portfolio  
Prospectus [Line Items]  
Bar Chart and Performance Table [Heading] Performance Information
Performance Narrative [Text Block]
Pursuant to an agreement and plan of reorganization, between the Company, on behalf of the Fund, and Morgan Stanley Emerging Markets Leaders Fund (Cayman) LP, a private fund managed by the Adviser (the “Private Fund”), at open of business  on January 6, 2015, the Fund acquired substantially all of the assets and liabilities of the Private Fund in exchange for shares of the Fund (the “Emerging Markets Leaders Reorganization”). The Private Fund commenced operations on June 30, 2011, and had an investment objective, policies, and strategies that were, in all material respects, the same as those of the Fund, and was managed in a manner that, in all material respects, complied with the investment guidelines and restrictions of the Fund. However, the Private Fund was not registered as an investment company under the Investment Company Act of 1940, as amended (the “1940 Act”), and therefore was not subject to certain investment limitations, diversification requirements, liquidity requirements, and other restrictions imposed by the 1940 Act and the Internal Revenue Code of 1986, as amended (the “Code”), which, if applicable, may have adversely affected its performance.
The Fund adopted the performance history of the Private Fund. As a result, the historical performance information shown below reflects, for the periods prior to the Emerging Markets Leaders Reorganization, the historical performance of the Private Fund. The performance of the Private Fund has been restated to reflect any applicable sales charge but is otherwise not adjusted to reflect differences in expenses between the Private Fund and each class, as applicable.
The bar chart and table below provide some indication of the risks of investing in the Fund by showing changes in the Fund’s Class I shares’ performance from year-to-year and by showing how the Fund’s average annual returns for the past one, five and 10 year periods and since inception compare with those of a broad measure of market performance. The performance of the other classes, which is shown in the table below, will differ because the classes have different ongoing fees. The Fund’s returns in the table include the maximum applicable sales charge for Class A and Class C and assume you sold your shares at the end of each period (unless otherwise noted). The Fund’s past performance, before and after taxes, is not necessarily an indication of how the Fund will perform in the future. Updated performance information is available online at www.morganstanley.com/im or by calling toll-free 1-800-869-6397.
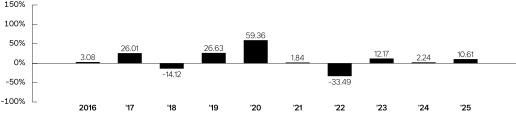
Performance Past Does Not Indicate Future [Text] The Fund’s past performance, before and after taxes, is not necessarily an indication of how the Fund will perform in the future.
Performance Information Illustrates Variability of Returns [Text] The bar chart and table below provide some indication of the risks of investing in the Fund by showing changes in the Fund’s Class I shares’ performance from year-to-year and by showing how the Fund’s average annual returns for the past one, five and 10 year periods and since inception compare with those of a broad measure of market performance.
Bar Chart [Heading] Annual Total Returns—Calendar Years
Bar Chart [Table]
image
Bar Chart Closing [Text Block]
High Quarter
06/30/20
32.55%
Low Quarter
03/31/20
-19.69%
Performance Table Heading Average Annual Total Returns(for the calendar periods ended  December 31, 2025)
Performance Table Does Reflect Sales Loads The Fund’s returns in the table include the maximum applicable sales charge for Class A and Class C and assume you sold your shares at the end of each period (unless otherwise noted).
Performance Table Uses Highest Federal Rate The after-tax returns shown in the table above are calculated using the historical highest individual federal marginal income tax rates during the period shown and do not reflect the impact of state and local taxes.
Performance Table Not Relevant to Tax Deferred Actual after-tax returns depend on the investor’s tax situation and may differ from those shown, and after-tax returns are not relevant to investors who hold their Fund shares through tax deferred arrangements such as 401(k) plans or individual retirement accounts.
Performance Table Explanation after Tax Higher After-tax returns may be higher than before-tax returns due to foreign tax credits and/or an assumed benefit from capital losses that would have been realized had Fund shares been sold at the end of the relevant periods, as applicable.
Performance [Table]
 
Past
One Year
Past
Five Years
Past
Ten Years
Since Inception
Class I (commenced operations on 6/30/2011)1


Return Before Taxes
10.61%
-2.99%
6.82%
4.82%
Return After Taxes on Distributions2
11.30%
-2.61%
6.82%
4.81%
Return After Taxes on Distributions and Sale of Fund Shares
6.96%
-1.88%
5.74%
4.07%
Class A (commenced operations on 6/30/2011)1


Return Before Taxes
4.34%
-4.36%
5.86%
4.14%
Class C (commenced operations on 4/30/2015)


Return Before Taxes
8.30%
-4.04%
5.79%
4.37%3
Class R6 (commenced operations on 6/30/2011)1


Return Before Taxes
10.63%
-2.93%
6.88%
4.86%
MSCI Emerging Markets Net Index (reflects no deduction for fees, expenses or taxes)4
33.57%
4.20%
8.42%
3.89%5
[78],[79],[80],[81],[82]
Performance Table One Class of after Tax Shown [Text] After-tax returns for the Fund’s other classes will vary from Class I shares’ returns.
Performance Table Closing [Text Block]
The after-tax returns shown in the table above are calculated using the historical highest individual federal marginal income tax rates during the period shown and do not reflect the impact of state and local taxes. After-tax returns for the Fund’s other classes will vary from Class I shares’ returns. Actual after-tax returns depend on the investor’s tax situation and may differ from those shown, and after-tax returns are not relevant to investors who hold their Fund shares through tax deferred arrangements such as 401(k) plans or individual retirement accounts. After-tax returns may be higher than before-tax returns due to foreign tax credits and/or an assumed benefit from capital losses that would have been realized had Fund shares been sold at the end of the relevant periods, as applicable.
Performance Availability Website Address [Text] www.morganstanley.com/im
Performance Availability Phone [Text] 1-800-869-6397
(MSIF - Emerging Markets Equity Portfolios - Classes I, A, L, C and R6) | Emerging Markets Leaders Portfolio | Class I  
Prospectus [Line Items]  
Highest Quarterly Return, Label [Optional Text] High Quarter
Highest Quarterly Return 32.55%
Highest Quarterly Return, Date Jun. 30, 2020
Lowest Quarterly Return, Label [Optional Text] Low Quarter
Lowest Quarterly Return (19.69%)
Lowest Quarterly Return, Date Mar. 31, 2020
(MSIF - Emerging Markets Equity Portfolios - Classes I, A, L, C and R6) | Emerging Markets Portfolio  
Prospectus [Line Items]  
Bar Chart and Performance Table [Heading] Performance Information
Performance Narrative [Text Block]
The bar chart and table below provide some indication of the risks of investing in the Fund by showing changes in the Fund’s Class I shares’ performance from year-to-year and by showing how the Fund’s average annual returns for the past one, five and 10 year periods and since inception compare with those of a broad measure of market performance. The performance of the other classes, which is shown in the table below, will differ because the classes have different ongoing fees. The Fund’s returns in the table include the maximum applicable sales charge for Class A and Class C  and assume you sold your shares at the end of each period (unless otherwise noted). The Fund’s past performance, before and after taxes, is not necessarily an indication of how the Fund will perform in the future. Updated performance information is available online at www.morganstanley.com/im or by calling toll-free 1-800-869-6397.
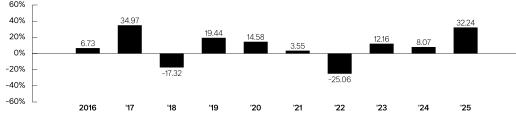
Performance Past Does Not Indicate Future [Text] The Fund’s past performance, before and after taxes, is not necessarily an indication of how the Fund will perform in the future.
Performance Information Illustrates Variability of Returns [Text] The bar chart and table below provide some indication of the risks of investing in the Fund by showing changes in the Fund’s Class I shares’ performance from year-to-year and by showing how the Fund’s average annual returns for the past one, five and 10 year periods and since inception compare with those of a broad measure of market performance.
Bar Chart [Heading] Annual Total Returns—Calendar Years
Bar Chart [Table]
image
Bar Chart Closing [Text Block]
High Quarter
06/30/20
19.82%
Low Quarter
03/31/20
-26.72%
Performance Table Heading Average Annual Total Returns(for the calendar periods ended  December 31, 2025)
Performance Table Does Reflect Sales Loads The performance of the other classes, which is shown in the table below, will differ because the classes have different ongoing fees. The Fund’s returns in the table include the maximum applicable sales charge for Class A and Class C  and assume you sold your shares at the end of each period (unless otherwise noted).
Performance Table Uses Highest Federal Rate The after-tax returns shown in the table above are calculated using the historical highest individual federal marginal income tax rates during the period shown and do not reflect the impact of state and local taxes.
Performance Table Not Relevant to Tax Deferred Actual after-tax returns depend on the investor’s tax situation and may differ from those shown, and after-tax returns are not relevant to investors who hold their Fund shares through tax deferred arrangements such as 401(k) plans or individual retirement accounts.
Performance Table Explanation after Tax Higher After-tax returns may be higher than before-tax returns due to an assumed benefit from capital losses that would have been realized had Fund shares been sold at the end of the relevant periods, as applicable.
Performance [Table]
 
Past
One Year
Past
Five Years
Past
Ten Years
Since Inception
Class I (commenced operations on 9/25/1992)


Return Before Taxes
32.24%
4.46%
7.32%
7.27%
Return After Taxes on Distributions1
16.88%
1.30%
5.35%
6.10%
Return After Taxes on Distributions and Sale of Fund Shares
29.95%
3.48%
5.93%
6.23%
Class A (commenced operations on 1/2/1996)


Return Before Taxes
24.89%
2.99%
6.40%
6.13%
Class L (commenced operations on 4/27/2012)


Return Before Taxes
31.18%
3.57%
6.40%
3.67%
Class C (commenced operations on 4/30/2015)


Return Before Taxes
30.19%
3.32%
6.30%
3.99%2
Class R6 (commenced operations on 9/13/2013)


Return Before Taxes
32.25%
4.52%
7.40%
4.82%
MSCI Emerging Markets Index (reflects no deduction for fees, expenses or taxes)3
33.57%
4.20%
8.42%
7.26%4
[83],[84],[85],[86]
Performance Table One Class of after Tax Shown [Text] After-tax returns for the Fund’s other classes will vary from Class I shares’ returns.
Performance Table Closing [Text Block]
The after-tax returns shown in the table above are calculated using the historical highest individual federal marginal income tax rates during the period shown and do not reflect the impact of state and local taxes. After-tax returns for the Fund’s other classes will vary from Class I shares’ returns. Actual after-tax returns depend on the investor’s tax situation and may differ from those shown, and after-tax returns are not relevant to investors who hold their Fund shares through tax deferred arrangements such as 401(k) plans or individual retirement accounts. After-tax returns may be higher than before-tax returns due to an assumed benefit from capital losses that would have been realized had Fund shares been sold at the end of the relevant periods, as applicable.
Performance Availability Website Address [Text] www.morganstanley.com/im
Performance Availability Phone [Text] 1-800-869-6397
(MSIF - Emerging Markets Equity Portfolios - Classes I, A, L, C and R6) | Emerging Markets Portfolio | Class I  
Prospectus [Line Items]  
Highest Quarterly Return, Label [Optional Text] High Quarter
Highest Quarterly Return 19.82%
Highest Quarterly Return, Date Jun. 30, 2020
Lowest Quarterly Return, Label [Optional Text] Low Quarter
Lowest Quarterly Return (26.72%)
Lowest Quarterly Return, Date Mar. 31, 2020
(MSIF - Emerging Markets Equity Portfolios - Class IR) | Passport Overseas Equity Portfolio  
Prospectus [Line Items]  
Bar Chart and Performance Table [Heading] Performance Information
Performance Narrative [Text Block]
The bar chart and table below provide some indication of the risks of investing in the Fund by showing changes in the Fund’s Class IR shares’ performance from year-to-year and by showing how the Fund’s average annual returns for the past one and five year periods and since inception compare with those of a broad measure of market performance and a custom benchmark.  The Fund’s past performance, before and after taxes, is not necessarily an indication of how the Fund will perform in the future. Updated performance information is available online at www.morganstanley.com/im or by calling toll-free 1-800-869-6397.
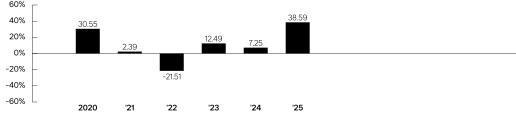
Performance Past Does Not Indicate Future [Text] The Fund’s past performance, before and after taxes, is not necessarily an indication of how the Fund will perform in the future.
Performance Information Illustrates Variability of Returns [Text] The bar chart and table below provide some indication of the risks of investing in the Fund by showing changes in the Fund’s Class IR shares’ performance from year-to-year and by showing how the Fund’s average annual returns for the past one and five year periods and since inception compare with those of a broad measure of market performance and a custom benchmark.
Bar Chart [Heading] Annual Total Returns—Calendar Years
Bar Chart [Table]
image
Bar Chart Closing [Text Block]
High Quarter
06/30/20
22.22%
Low Quarter
03/31/20
-21.66%
Performance Table Heading Average Annual Total Returns(for the calendar periods ended  December 31, 2025)
Performance Table Uses Highest Federal Rate The after-tax returns shown in the table above are calculated using the historical highest individual federal marginal income tax rates during the period shown and do not reflect the impact of state and local taxes.
Performance Table Not Relevant to Tax Deferred Actual after-tax returns depend on the investor’s tax situation and may differ from those shown, and after-tax returns are not relevant to investors who hold their Fund shares through tax deferred arrangements such as 401(k) plans or individual retirement accounts.
Performance Table Explanation after Tax Higher After-tax returns may be higher than before-tax returns due to an assumed benefit from capital losses that would have been realized had Fund shares been sold at the end of the relevant periods, as applicable.
Performance [Table]
 
Past
One Year
Past
Five Years
Since
Inception
Class IR  (commenced operations on 10/31/2019)
 
 
Return Before Taxes
38.59%
6.09%
10.78%
Return After Taxes on Distributions1
34.82%
4.70%
9.50%
Return After Taxes on Distributions and Sale of Fund Shares
25.77%
4.61%
8.48%
MSCI All Country World ex USA Index (reflects no deduction for fees, expenses or taxes)2
32.39%
7.91%
9.02%3
[87],[88],[89]
Performance Table One Class of after Tax Shown [Text] After-tax returns for the Fund’s other classes  will vary from Class IR shares’ returns.
Performance Table Closing [Text Block]
The after-tax returns shown in the table above are calculated using the historical highest individual federal marginal income tax rates during the period shown and do not reflect the impact of state and local taxes. After-tax returns for the Fund’s other classes  will vary from Class IR shares’ returns. Actual after-tax returns depend on the investor’s tax situation and may differ from those shown, and after-tax returns are not relevant to investors who hold their Fund shares through tax deferred arrangements such as 401(k) plans or individual retirement accounts. After-tax returns may be higher than before-tax returns due to an assumed benefit from capital losses that would have been realized had Fund shares been sold at the end of the relevant periods, as applicable.
Performance Availability Website Address [Text] www.morganstanley.com/im
Performance Availability Phone [Text] 1-800-869-6397
(MSIF - Emerging Markets Equity Portfolios - Class IR) | Passport Overseas Equity Portfolio | Class IR  
Prospectus [Line Items]  
Highest Quarterly Return, Label [Optional Text] High Quarter
Highest Quarterly Return 22.22%
Highest Quarterly Return, Date Jun. 30, 2020
Lowest Quarterly Return, Label [Optional Text] Low Quarter
Lowest Quarterly Return (21.66%)
Lowest Quarterly Return, Date Mar. 31, 2020
(MSIF - Emerging Markets Equity Portfolios - Class IR) | Emerging Markets Leaders Portfolio  
Prospectus [Line Items]  
Bar Chart and Performance Table [Heading] Performance Information
Performance Narrative [Text Block]
The bar chart and table below provide some indication of the risks of investing in the Fund by showing changes in the Fund’s Class IR shares’ performance from year-to-year and by showing how the Fund’s average annual returns for the past one year period and since inception compare with those of a broad measure of market performance. The Fund’s past performance, before and after taxes, is not necessarily an indication of how the Fund will perform in the future. Updated performance information is available online at www.morganstanley.com/im or by calling toll-free 1-800-869-6397.
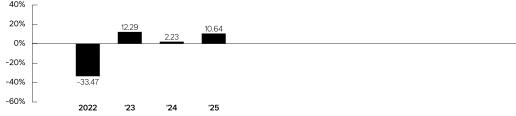
Performance Past Does Not Indicate Future [Text] The Fund’s past performance, before and after taxes, is not necessarily an indication of how the Fund will perform in the future.
Performance Information Illustrates Variability of Returns [Text] The bar chart and table below provide some indication of the risks of investing in the Fund by showing changes in the Fund’s Class IR shares’ performance from year-to-year and by showing how the Fund’s average annual returns for the past one year period and since inception compare with those of a broad measure of market performance.
Bar Chart [Heading] Annual Total Returns—Calendar Years
Bar Chart [Table]
image
Bar Chart Closing [Text Block]
High Quarter
06/30/20
32.55%
Low Quarter
03/31/20
-19.69%
Performance Table Heading Average Annual Total Returns(for the calendar periods ended  December 31, 2025)
Performance Table Uses Highest Federal Rate The after-tax returns shown in the table above are calculated using the historical highest individual federal marginal income tax rates during the period shown and do not reflect the impact of state and local taxes.
Performance Table Not Relevant to Tax Deferred Actual after-tax returns depend on the investor’s tax situation and may differ from those shown, and after-tax returns are not relevant to investors who hold their Fund shares through tax deferred arrangements such as 401(k) plans or individual retirement accounts.
Performance Table Explanation after Tax Higher After-tax returns may be higher than before-tax returns due to foreign tax credits and/or an assumed benefit from capital losses that would have been realized had Fund shares been sold at the end of the relevant periods, as applicable.
Performance [Table]
 
Past
One Year
Since
Inception
Class IR  (commenced operations on 04/12/2021)
Return Before Taxes
10.64%
-3.03%
Return After Taxes on Distributions1
11.33%
-2.63%
Return After Taxes on Distributions and Sale of Fund Shares
6.98%
-1.89%
MSCI Emerging Markets Net Index (reflects no deduction for fees, expenses or taxes)2
33.57%
3.85%3
[90],[91],[92]
Performance Table One Class of after Tax Shown [Text] After-tax returns for the Fund’s other classes  will vary from Class IR shares’ returns.
Performance Table Closing [Text Block]
The after-tax returns shown in the table above are calculated using the historical highest individual federal marginal income tax rates during the period shown and do not reflect the impact of state and local taxes. After-tax returns for the Fund’s other classes  will vary from Class IR shares’ returns. Actual after-tax returns depend on the investor’s tax situation and may differ from those shown, and after-tax returns are not relevant to investors who hold their Fund shares through tax deferred arrangements such as 401(k) plans or individual retirement accounts. After-tax returns may be higher than before-tax returns due to foreign tax credits and/or an assumed benefit from capital losses that would have been realized had Fund shares been sold at the end of the relevant periods, as applicable.
Performance Availability Website Address [Text] www.morganstanley.com/im
Performance Availability Phone [Text] 1-800-869-6397
(MSIF - Emerging Markets Equity Portfolios - Class IR) | Emerging Markets Leaders Portfolio | Class IR  
Prospectus [Line Items]  
Highest Quarterly Return, Label [Optional Text] High Quarter
Highest Quarterly Return 32.55%
Highest Quarterly Return, Date Jun. 30, 2020
Lowest Quarterly Return, Label [Optional Text] Low Quarter
Lowest Quarterly Return (19.69%)
Lowest Quarterly Return, Date Mar. 31, 2020
(MSIF - Emerging Markets Equity Portfolios - Class IR) | Emerging Markets Portfolio  
Prospectus [Line Items]  
Bar Chart and Performance Table [Heading] Performance Information
Performance Narrative [Text Block]
The bar chart and table below provide some indication of the risks of investing in the Fund by showing changes in the Fund’s Class IR shares’ performance from year-to-year and by showing how the Fund’s average annual returns for the past one and five year periods and since inception compare with those of a broad measure of market performance. The Fund’s past performance, before and after taxes, is not necessarily an indication of how the Fund will perform in the future. Updated performance information is available online at www.morganstanley.com/im or by calling toll-free 1-800-869-6397.
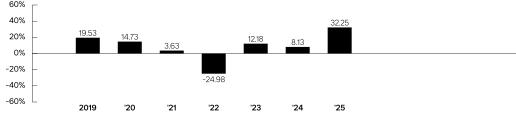
Performance Past Does Not Indicate Future [Text] The Fund’s past performance, before and after taxes, is not necessarily an indication of how the Fund will perform in the future.
Performance Information Illustrates Variability of Returns [Text] The bar chart and table below provide some indication of the risks of investing in the Fund by showing changes in the Fund’s Class IR shares’ performance from year-to-year and by showing how the Fund’s average annual returns for the past one and five year periods and since inception compare with those of a broad measure of market performance.
Bar Chart [Heading] Annual Total Returns—Calendar Years
Bar Chart [Table]
image
Bar Chart Closing [Text Block]
High Quarter
06/30/20
19.82%
Low Quarter
03/31/20
-26.72%
Performance Table Heading Average Annual Total Returns(for the calendar periods ended  December 31, 2025)
Performance Table Uses Highest Federal Rate The after-tax returns shown in the table above are calculated using the historical highest individual federal marginal income tax rates during the period shown and do not reflect the impact of state and local taxes.
Performance Table Not Relevant to Tax Deferred Actual after-tax returns depend on the investor’s tax situation and may differ from those shown, and after-tax returns are not relevant to investors who hold their Fund shares through tax deferred arrangements such as 401(k) plans or individual retirement accounts.
Performance Table Explanation after Tax Higher After-tax returns may be higher than before-tax returns due to an assumed benefit from capital losses that would have been realized had Fund shares been sold at the end of the relevant periods, as applicable.
Performance [Table]
 
Past
One Year
Past
Five Years
Since
Inception
Class IR  (commenced operations on 06/15/2018)
 
Return Before Taxes
32.25%
4.52%
5.60%
Return After Taxes on Distributions1
16.86%
1.24%
2.86%
Return After Taxes on Distributions and Sale of Fund Shares
29.99%
3.43%
4.22%
MSCI Emerging Markets Index (reflects no deduction for fees, expenses or taxes)2
33.57%
4.20%
5.67%3
[93],[94],[95]
Performance Table One Class of after Tax Shown [Text] After-tax returns for the Fund’s other classes  will vary from Class IR shares’ returns.
Performance Table Closing [Text Block]
The after-tax returns shown in the table above are calculated using the historical highest individual federal marginal income tax rates during the period shown and do not reflect the impact of state and local taxes. After-tax returns for the Fund’s other classes  will vary from Class IR shares’ returns. Actual after-tax returns depend on the investor’s tax situation and may differ from those shown, and after-tax returns are not relevant to investors who hold their Fund shares through tax deferred arrangements such as 401(k) plans or individual retirement accounts. After-tax returns may be higher than before-tax returns due to an assumed benefit from capital losses that would have been realized had Fund shares been sold at the end of the relevant periods, as applicable.
Performance Availability Website Address [Text] www.morganstanley.com/im
Performance Availability Phone [Text] 1-800-869-6397
(MSIF - Emerging Markets Equity Portfolios - Class IR) | Emerging Markets Portfolio | Class IR  
Prospectus [Line Items]  
Highest Quarterly Return, Label [Optional Text] High Quarter
Highest Quarterly Return 19.82%
Highest Quarterly Return, Date Jun. 30, 2020
Lowest Quarterly Return, Label [Optional Text] Low Quarter
Lowest Quarterly Return (26.72%)
Lowest Quarterly Return, Date Mar. 31, 2020
(MSIF - International Equity Portfolios - Classes I, A, L, C and R6) | Global Franchise Portfolio  
Prospectus [Line Items]  
Bar Chart and Performance Table [Heading] Performance Information
Performance Narrative [Text Block]
The bar chart and table below provide some indication of the risks of investing in the Fund by showing changes in the Fund’s Class I shares’ performance from year-to-year and by showing how the Fund’s average annual returns for the past one, five and 10 year periods and since inception compare with those of a broad measure of market performance. The performance of the other classes, which is shown in the table below, will differ because the classes have different ongoing fees. The Fund’s returns in the table include the maximum applicable sales charge for Class A and Class C  and assume you sold your shares at the end of each period (unless otherwise noted). The Fund’s past performance, before and after taxes, is not necessarily an indication of how the Fund will perform in the future. Updated performance information is available online at www.morganstanley.com/im or by calling toll-free 1-800-869-6397.
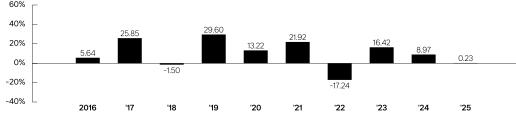
Performance Past Does Not Indicate Future [Text] The Fund’s past performance, before and after taxes, is not necessarily an indication of how the Fund will perform in the future.
Performance Information Illustrates Variability of Returns [Text] The bar chart and table below provide some indication of the risks of investing in the Fund by showing changes in the Fund’s Class I shares’ performance from year-to-year and by showing how the Fund’s average annual returns for the past one, five and 10 year periods and since inception compare with those of a broad measure of market performance.
Bar Chart [Heading] Annual Total Returns—Calendar Years
Bar Chart [Table]
image
Bar Chart Closing [Text Block]
High Quarter
06/30/20
15.77%
Low Quarter
03/31/20
-13.07%
Performance Table Heading Average Annual Total Returns(for the calendar periods ended  December 31, 2025)
Performance Table Does Reflect Sales Loads The Fund’s returns in the table include the maximum applicable sales charge for Class A and Class C  and assume you sold your shares at the end of each period (unless otherwise noted).
Performance Table Uses Highest Federal Rate The after-tax returns shown in the table above are calculated using the historical highest individual federal marginal income tax rates during the period shown and do not reflect the impact of state and local taxes.
Performance Table Not Relevant to Tax Deferred Actual after-tax returns depend on the investor’s tax situation and may differ from those shown, and after-tax returns are not relevant to investors who hold their Fund shares through tax deferred arrangements such as 401(k) plans or individual retirement accounts.
Performance Table Explanation after Tax Higher After-tax returns may be higher than before-tax returns due to an assumed benefit from capital losses that would have been realized had Fund shares been sold at the end of the relevant periods, as applicable.
Performance [Table]
 
Past
One Year
Past
Five Years
Past
Ten Years
Since Inception
Class I (commenced operations on 11/28/2001)


Return Before Taxes
0.23%
5.11%
9.44%
10.36%
Return After Taxes on Distributions1
-2.60%
3.67%
8.13%
9.25%
Return After Taxes on Distributions and Sale of Fund Shares
2.14%
3.96  %
7.57%
8.83%
Class A (commenced operations on 11/28/2001)


Return Before Taxes
-5.30%
3.72%
8.58%
9.83%
Class L (commenced operations on 4/27/2012)


Return Before Taxes
-0.58%
4.32%
8.62%
8.43%
Class C (commenced operations on 9/30/2015)


Return Before Taxes
-1.64%
4.08%
8.52%
8.85%2
Class R6 (commenced operations on 5/29/2015)


Return Before Taxes
0.36%
5.21%
9.54%
9.03%
MSCI World Net Index (reflects no deduction for fees, expenses or taxes)3
21.09%
12.15%
12.17%
8.40%4
[96],[97],[98],[99]
Performance Table One Class of after Tax Shown [Text] After-tax returns for the Fund’s other classes will vary from Class I shares’ returns.
Performance Table Closing [Text Block]
The after-tax returns shown in the table above are calculated using the historical highest individual federal marginal income tax rates during the period shown and do not reflect the impact of state and local taxes. After-tax returns for the Fund’s other classes will vary from Class I shares’ returns. Actual after-tax returns depend on the investor’s tax situation and may differ from those shown, and after-tax returns are not relevant to investors who hold their Fund shares through tax deferred arrangements such as 401(k) plans or individual retirement accounts. After-tax returns may be higher than before-tax returns due to an assumed benefit from capital losses that would have been realized had Fund shares been sold at the end of the relevant periods, as applicable.
Performance Availability Website Address [Text] www.morganstanley.com/im
Performance Availability Phone [Text] 1-800-869-6397
(MSIF - International Equity Portfolios - Classes I, A, L, C and R6) | Global Franchise Portfolio | Class I  
Prospectus [Line Items]  
Highest Quarterly Return, Label [Optional Text] High Quarter
Highest Quarterly Return 15.77%
Highest Quarterly Return, Date Jun. 30, 2020
Lowest Quarterly Return, Label [Optional Text] Low Quarter
Lowest Quarterly Return (13.07%)
Lowest Quarterly Return, Date Mar. 31, 2020
(MSIF - International Equity Portfolios - Classes I, A, L, C and R6) | Global Stars Portfolio  
Prospectus [Line Items]  
Bar Chart and Performance Table [Heading] Performance Information
Performance Narrative [Text Block]
The bar chart and table below provide some indication of the risks of investing in the Fund by showing changes in the Fund’s Class I shares’ performance from year-to-year and by showing how the Fund’s average annual returns for the past one, five and ten year periods and since inception compare with a broad measure of market performance and one or more additional indexes. The performance of the other classes, which is shown in the table below, will differ because the classes have different ongoing fees. The Fund’s returns in the table include the maximum applicable sales charge for Class A and Class C and assume you sold your shares at the end of each period (unless otherwise noted). The Fund changed its name from Global Sustain Portfolio to Global Stars Portfolio effective June 27, 2024. Additionally, effective June 27, 2024, the Fund changed its primary benchmark to the MSCI All Country World Net Index because the Adviser believes it is a more appropriate benchmark for the Fund. Prior to June 27, 2024, the Fund was managed pursuant to a different investment strategy. Performance information for periods prior to June 27, 2024 does not reflect the Fund’s current investment strategy.  The Fund’s past performance, before and after taxes, is not necessarily an indication of how the Fund will perform in the future. Updated performance information is available online at www.morganstanley.com/im  or by calling toll-free 1-800-869-6397.
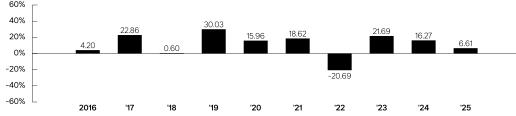
Performance Past Does Not Indicate Future [Text] The Fund’s past performance, before and after taxes, is not necessarily an indication of how the Fund will perform in the future.
Performance Information Illustrates Variability of Returns [Text] The bar chart and table below provide some indication of the risks of investing in the Fund by showing changes in the Fund’s Class I shares’ performance from year-to-year and by showing how the Fund’s average annual returns for the past one, five and ten year periods and since inception compare with a broad measure of market performance and one or more additional indexes.
Bar Chart [Heading] Annual Total Returns—Calendar Years
Bar Chart [Table]
image
Bar Chart Closing [Text Block]
High Quarter
06/30/20
17.74%
Low Quarter
03/31/20
-13.85%
Performance Table Heading Average Annual Total Returns(for the calendar periods ended  December 31, 2025)
Performance Table Does Reflect Sales Loads The Fund’s returns in the table include the maximum applicable sales charge for Class A and Class C and assume you sold your shares at the end of each period (unless otherwise noted).
Performance Table Uses Highest Federal Rate The after-tax returns shown in the table above are calculated using the historical highest individual federal marginal income tax rates during the period shown and do not reflect the impact of state and local taxes.
Performance Table Not Relevant to Tax Deferred Actual after-tax returns depend on the investor’s tax situation and may differ from those shown, and after-tax returns are not relevant to investors who hold their Fund shares through tax deferred arrangements such as 401(k) plans or individual retirement accounts.
Performance Table Explanation after Tax Higher After-tax returns may be higher than before-tax returns due to an assumed benefit from capital losses that would have been realized had Fund shares been sold at the end of the relevant periods, as applicable.
Performance [Table]
 
Past
One Year
Past
Five Years
Past
Ten Years
Since Inception
Class I (commenced operations on 8/30/2013)


Return Before Taxes
6.61%
7.25%
10.67%
10.32%
Return After Taxes on Distributions1
0.26%
4.61%
8.57%
8.48%
Return After Taxes on Distributions and Sale of Fund Shares
8.17%
5.60%
8.47  %
8.30%
 
Past
One Year
Past
Five Years
Past
Ten Years
Since Inception
Class A (commenced operations on 8/30/2013)


Return Before Taxes
0.68%
5.76%
9.70%
9.47%
Class L (commenced operations on 8/30/2013)


Return Before Taxes
5.77%
6.35%
9.73%
9.39%
Class C (commenced operations on 4/30/2015)


Return Before Taxes
4.69%
6.09%
9.63%
9.04%2
Class R6 (commenced operations on 09/13/2013)


Return Before Taxes
6.67%
7.31%
10.71%
10.15%
MSCI All Country World Net Index (reflects no deduction for fees, expenses or taxes)3
22.34%
11.19%
11.72%
10.63%4
MSCI World/MSCI All Country World Blended Index (reflects no deduction for fees, expenses or taxes)5
22.34%
12.25%
12.22%
11.28%4
[100],[101],[102],[103],[104]
Performance Table One Class of after Tax Shown [Text] After-tax returns for the Fund’s other classes will vary from Class I shares’ returns.
Performance Table Closing [Text Block]
The after-tax returns shown in the table above are calculated using the historical highest individual federal marginal income tax rates during the period shown and do not reflect the impact of state and local taxes. After-tax returns for the Fund’s other classes will vary from Class I shares’ returns. Actual after-tax returns depend on the investor’s tax situation and may differ from those shown, and after-tax returns are not relevant to investors who hold their Fund shares through tax deferred arrangements such as 401(k) plans or individual retirement accounts. After-tax returns may be higher than before-tax returns due to an assumed benefit from capital losses that would have been realized had Fund shares been sold at the end of the relevant periods, as applicable.
Performance Availability Website Address [Text] www.morganstanley.com/im
Performance Availability Phone [Text] 1-800-869-6397
(MSIF - International Equity Portfolios - Classes I, A, L, C and R6) | Global Stars Portfolio | Class I  
Prospectus [Line Items]  
Highest Quarterly Return, Label [Optional Text] High Quarter
Highest Quarterly Return 17.74%
Highest Quarterly Return, Date Jun. 30, 2020
Lowest Quarterly Return, Label [Optional Text] Low Quarter
Lowest Quarterly Return (13.85%)
Lowest Quarterly Return, Date Mar. 31, 2020
(MSIF - International Equity Portfolios - Classes I, A, L, C and R6) | International Equity Portfolio  
Prospectus [Line Items]  
Bar Chart and Performance Table [Heading] Performance Information
Performance Narrative [Text Block]
The bar chart and table below provide some indication of the risks of investing in the Fund by showing changes in the Fund’s Class I shares’ performance from year-to-year and by showing how the Fund’s average annual returns for the past one, five and 10 year periods and since inception compare with those of a broad measure of market performance. The performance of the other classes, which is shown in the table below, will differ because the classes have different ongoing fees. The Fund’s returns in the table include the maximum applicable sales charge for Class A and Class C  and assume you sold your shares at the end of each period (unless otherwise noted). The Fund’s past performance, before and after taxes, is not necessarily an indication of how the Fund will perform in the future. Updated performance information is available online at www.morganstanley.com/im or by calling toll-free 1-800-869-6397.
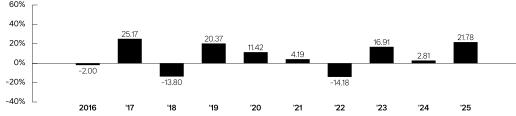
Performance Past Does Not Indicate Future [Text] The Fund’s past performance, before and after taxes, is not necessarily an indication of how the Fund will perform in the future.
Performance Information Illustrates Variability of Returns [Text] The bar chart and table below provide some indication of the risks of investing in the Fund by showing changes in the Fund’s Class I shares’ performance from year-to-year and by showing how the Fund’s average annual returns for the past one, five and 10 year periods and since inception compare with those of a broad measure of market performance.
Bar Chart [Heading] Annual Total Returns—Calendar Years
Bar Chart [Table]
image
Bar Chart Closing [Text Block]
High Quarter
06/30/20
18.33%
Low Quarter
03/31/20
-20.42%
Performance Table Heading Average Annual Total Returns(for the calendar periods ended  December 31, 2025)
Performance Table Does Reflect Sales Loads The Fund’s returns in the table include the maximum applicable sales charge for Class A and Class C  and assume you sold your shares at the end of each period (unless otherwise noted).
Performance Table Uses Highest Federal Rate The after-tax returns shown in the table above are calculated using the historical highest individual federal marginal income tax rates during the period shown and do not reflect the impact of state and local taxes.
Performance Table Not Relevant to Tax Deferred Actual after-tax returns depend on the investor’s tax situation and may differ from those shown, and after-tax returns are not relevant to investors who hold their Fund shares through tax deferred arrangements such as 401(k) plans or individual retirement accounts.
Performance Table Explanation after Tax Higher After-tax returns may be higher than before-tax returns due to an assumed benefit from capital losses that would have been realized had Fund shares been sold at the end of the relevant periods, as applicable.
Performance [Table]
 
Past
One Year
Past
Five Years
Past
Ten Years
Since Inception
Class I    (commenced operations on 8/4/1989)


Return Before Taxes
21.78%
5.53%
6.38%
7.87%
Return After Taxes on Distributions1
7.68%
0.62%
3.29%
5.98%
Return After Taxes on Distributions and Sale of Fund Shares
21.13%
3.86%
4.78%
6.40%
Class A (commenced operations on 1/2/1996)


Return Before Taxes
15.16%
4.13%
5.49%
6.76%
Class L (commenced operations on 6/14/2012)


Return Before Taxes
20.87%
4.65%
5.49%
6.00%
Class C (commenced operations on 4/30/2015)


Return Before Taxes
19.87%
4.37%
5.39%
4.12%2
Class R6 (commenced operations on 9/13/2013)


Return Before Taxes
21.82%
5.57%
6.41%
5.29%
MSCI EAFE Index (reflects no deduction for fees, expenses or taxes)3
31.22%
8.92%
8.18%
5.34%4
[105],[106],[107],[108]
Performance Table One Class of after Tax Shown [Text] After-tax returns for the Fund’s other classes will vary from Class I shares’ returns.
Performance Table Closing [Text Block]
The after-tax returns shown in the table above are calculated using the historical highest individual federal marginal income tax rates during the period shown and do not reflect the impact of state and local taxes. After-tax returns for the Fund’s other classes will vary from Class I shares’ returns. Actual after-tax returns depend on the investor’s tax situation and may differ from those shown, and after-tax returns are not relevant to investors who hold their Fund shares through tax deferred arrangements such as 401(k) plans or individual retirement accounts. After-tax returns may be higher than before-tax returns due to an assumed benefit from capital losses that would have been realized had Fund shares been sold at the end of the relevant periods, as applicable.
Performance Availability Website Address [Text] www.morganstanley.com/im
Performance Availability Phone [Text] 1-800-869-6397
(MSIF - International Equity Portfolios - Classes I, A, L, C and R6) | International Equity Portfolio | Class I  
Prospectus [Line Items]  
Highest Quarterly Return, Label [Optional Text] High Quarter
Highest Quarterly Return 18.33%
Highest Quarterly Return, Date Jun. 30, 2020
Lowest Quarterly Return, Label [Optional Text] Low Quarter
Lowest Quarterly Return (20.42%)
Lowest Quarterly Return, Date Mar. 31, 2020
(MSIF - International Equity Portfolios - Classes I, A, L, C and R6) | International Resilience Portfolio  
Prospectus [Line Items]  
Bar Chart and Performance Table [Heading] Performance Information
Performance Narrative [Text Block]
The bar chart and table below provide some indication of the risks of investing in the Fund by showing changes in the Fund’s Class I shares’ performance for one year and by showing how the Fund’s average annual returns for the past one year period and since inception compare with those of a broad measure of market performance. The performance of the other classes, which is shown in the table below, will differ because the classes have different ongoing fees. The Fund’s returns in the table include the maximum applicable sales charge for Class A and Class C and assume you sold your shares at the end of each period (unless otherwise noted). The Fund’s past performance, before and after taxes, is not necessarily an indication of how the Fund will perform in the future. Updated performance information is available online at www.morganstanley.com/im or by calling toll-free 1-800-869-6397.
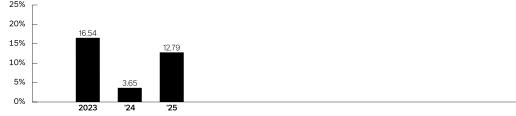
Performance Past Does Not Indicate Future [Text] The Fund’s past performance, before and after taxes, is not necessarily an indication of how the Fund will perform in the future.
Performance Information Illustrates Variability of Returns [Text] The bar chart and table below provide some indication of the risks of investing in the Fund by showing changes in the Fund’s Class I shares’ performance for one year and by showing how the Fund’s average annual returns for the past one year period and since inception compare with those of a broad measure of market performance.
Bar Chart [Heading] Annual Total Returns—Calendar Years
Bar Chart [Table]
image
Bar Chart Closing [Text Block]
High Quarter
03/31/23
12.91%
Low Quarter
09/30/23
-9.70%
Performance Table Heading Average Annual Total Returns(for the calendar periods ended  December 31, 2025)
Performance Table Does Reflect Sales Loads The Fund’s returns in the table include the maximum applicable sales charge for Class A and Class C and assume you sold your shares at the end of each period (unless otherwise noted).
Performance [Table]
 
Past
One Year
Since
Inception
Class I (commenced operations on 7/29/2022)
 
Return Before Taxes
12.79%
8.68%
Return After Taxes on Distributions1
11.81%
8.02%
Return After Taxes on Distributions and Sale of Fund Shares
8.25%
6.76%
Class A (commenced operations on 7/29/2022)
 
Return Before Taxes
6.49%
6.63%
Class C (commenced operations on 7/29/2022)
Return Before Taxes
10.61%
7.51%
 
Past
One Year
Since
Inception
Class R6 (commenced operations on 7/29/2022)
 
Return Before Taxes
12.83%
8.75%
MSCI All Country World ex USA Net Index (reflects no deduction for fees, expenses or taxes)2
32.29%
14.88%3
[109],[110],[111]
Performance Availability Website Address [Text] www.morganstanley.com/im
Performance Availability Phone [Text] 1-800-869-6397
(MSIF - International Equity Portfolios - Classes I, A, L, C and R6) | International Resilience Portfolio | Class I  
Prospectus [Line Items]  
Highest Quarterly Return, Label [Optional Text] High Quarter
Highest Quarterly Return 12.91%
Highest Quarterly Return, Date Mar. 31, 2023
Lowest Quarterly Return, Label [Optional Text] Low Quarter
Lowest Quarterly Return (9.70%)
Lowest Quarterly Return, Date Sep. 30, 2023
[1]
1 Performance shown for the Fund’s Class I and Class L shares reflects the performance of the Class I and Class C shares, respectively, of the Predecessor Fund for periods prior to May 21, 2010.
[2]
2 These returns do not reflect any tax consequences from a sale of your shares at the end of each period.
[3]
3 Class C shares will generally automatically convert to Class A shares eight years after the end of the calendar month in which the shares were purchased. Performance for periods greater than eight years reflects this conversion.
[4]
4 The Standard & Poor’s 500® Index (S&P 500® Index) measures the performance of the large cap segment of the U.S. equities market, covering approximately 80% of the U.S. equities market. The S&P 500® Index includes 500 leading companies in leading industries of the U.S. economy. It is not possible to invest directly in an index.
[5]
5 Since Inception reflects the inception date of Class I.
[6]
6 The Russell 1000® Growth Index measures the performance of the large-cap growth segment of the U.S. equity universe. It includes those Russell 1000® Index companies with higher price-to-book ratios and higher forecasted growth values. The Russell 1000® Index is an index of approximately 1,000 of the largest U.S. companies based on a combination of market capitalization and current index membership. It is not possible to invest directly in an index.
[7]
1 These returns do not reflect any tax consequences from a sale of your shares at the end of each period.
[8]
2 The MSCI All Country World Net Index  is a free float-adjusted market capitalization weighted index designed to measure the equity market performance of developed and emerging markets. The term “free float” represents the portion of shares outstanding that are deemed to be available for purchase in the public equity markets by investors. The performance of the index is listed in U.S. dollars and assumes reinvestment of net dividends. Net total return indices reinvest dividends after the deduction of withholding taxes, using (for international indices) a tax rate applicable to non-resident institutional investors who do not benefit from double taxation treaties. It is not possible to invest directly in an index.
[9]
3 Since Inception reflects the inception date of the Fund.
[10]
1 These returns do not reflect any tax consequences from a sale of your shares at the end of each period.
[11]
2 Class C shares will generally automatically convert to Class A shares eight years after the end of the calendar month in which the shares were purchased. Performance for periods greater than eight years reflects this conversion.
[12]
3 The MSCI All Country World Net Index is a free float-adjusted market capitalization weighted index designed to measure the equity market performance of developed and emerging markets. The term “free float” represents the portion of shares outstanding that are deemed to be available for purchase in the public equity markets by investors. The performance of the index is listed in U.S. dollars and assumes reinvestment of net dividends. Net total return indices reinvest dividends after the deduction of withholding taxes, using (for international indices) a tax rate applicable to non-resident institutional investors who do not benefit from double taxation treaties. It is not possible to invest directly in an index.
[13]
4 Since Inception reflects the inception date of Class I.
[14]
1 These returns do not reflect any tax consequences from a sale of your shares at the end of each period.
[15]
2 The MSCI All Country World Net Index is a free float-adjusted market capitalization weighted index designed to measure the equity market performance of developed and emerging markets. The term “free float” represents the portion of shares outstanding that are deemed to be available for purchase in the public equity markets by investors. The performance of the index is listed in U.S. dollars and assumes reinvestment of net dividends. Net total return indices reinvest dividends after the deduction of withholding taxes, using (for international indices) a tax rate applicable to non-resident institutional investors who do not benefit from double taxation treaties. It is not possible to invest directly in an index.
[16]
3 Since Inception reflects the inception date of the Fund.
[17]
1 These returns do not reflect any tax consequences from a sale of your shares at the end of each period.
[18]
2 Class C shares will generally automatically convert to Class A shares eight years after the end of the calendar month in which the shares were purchased. Performance for periods greater than eight years reflects this conversion.
[19]
3 The Russell 1000® Index measures the performance of the large-cap segment of the U.S. equity universe. It is a subset of the Russell 3000® Index and includes approximately 1,000 of the largest securities based on a combination of their market capitalization and current index membership. The Russell 3000® Index measures the performance of the largest 3,000 U.S. companies representing approximately 98% of the investable  U.S. equity market. It is not possible to invest directly in an index.
[20]
4 Since Inception reflects the inception date of Class I.
[21]
5 The Russell 1000® Growth Index measures the performance of the large-cap growth segment of the U.S. equity universe. It includes those Russell 1000® Index companies with higher price-to-book ratios and higher forecasted growth values. It is not possible to invest directly in an index.
[22]
1 These returns do not reflect any tax consequences from a sale of your shares at the end of each period.
[23]
2 Class C shares will generally automatically convert to Class A shares eight years after the end of the calendar month in which the shares were purchased. Performance for periods greater than eight years reflects this conversion.
[24]
3 The Russell 3000® Index measures the performance of the largest 3000 U.S. companies representing approximately 98% of the investable U.S. equity market. The Russell 3000® Index is constructed to provide a comprehensive, unbiased and stable barometer of the broad market and is completely reconstituted annually to ensure new and growing equities are included. It is not possible to invest directly in an index.
[25]
4 Since Inception reflects the inception date of Class I.
[26]
5 The Russell 2000® Growth Index measures the performance of the small-cap growth segment of the U.S. equity universe. It includes those Russell 2000® Index companies with higher price-to-book ratios and higher forecasted growth values. The Russell 2000® Index is a subset of the Russell 3000® Index representing approximately 10% of the total market capitalization of that index. It includes approximately 2,000 of the smallest securities based on a combination of their market capitalization and current index membership. It is not possible to invest directly in an index.
[27]
1 These returns do not reflect any tax consequences from a sale of your shares at the end of each period.
[28]
2 The Standard & Poor’s 500® Index (S&P 500® Index) measures the performance of the large cap segment of the U.S. equities market, covering approximately 80% of the U.S. equities market. The Index includes 500 leading companies in leading industries of the U.S. economy. The Index is unmanaged and its returns do not include any sales charges or fees. Such costs would lower performance. It is not possible to invest directly in an index.
[29]
3 Since Inception reflects the inception date of the Fund.
[30]
1 These returns do not reflect any tax consequences from a sale of your shares at the end of each period.
[31]
2 The Russell 3000® Index measures the performance of the largest 3,000 U.S. companies designed to represent approximately 98% of the investable U.S. equity market. The Russell 3000® Index is constructed to provide a comprehensive, unbiased and stable barometer of the broad market and is completely reconstituted annually to ensure new and growing equities are included. It is not possible to invest directly in an index.
[32]
3 Since Inception reflects the inception date of the Fund.
[33]
4 The Russell 3000® Health Care Net Index is a capitalization-weighted index of companies involved in medical services or health care. It is not possible to invest directly in an index.
[34]
1 These returns do not reflect any tax consequences from a sale of your shares at the end of each period.
[35]
2 Class C shares will generally automatically convert to Class A shares eight years after the end of the calendar month in which the shares were purchased. Performance for periods greater than eight years reflects this conversion.
[36]
3 The MSCI All Country Asia ex Japan Net Index is a free float-adjusted market capitalization weighted index that is designed to measure the equity market performance of Asia, excluding Japan. The performance of the index is listed in U.S. dollars and assumes reinvestment of net dividends. Net total return indices reinvest dividends after the deduction of withholding taxes, using (for international indices) a tax rate applicable to non-resident institutional investors who do not benefit from double taxation treaties. It is not possible to invest directly in an index.
[37]
4 Since Inception reflects the inception date of the Fund.
[38]
1 These returns do not reflect any tax consequences from a sale of your shares at the end of each period.
[39]
2 The MSCI Emerging Markets Net Index is a free float-adjusted market capitalization weighted index that is designed to measure equity market performance of emerging markets. The term “free float” represents the portion of shares outstanding that are deemed to be available for purchase in the public equity markets by investors. The MSCI Emerging Markets Net Index currently consists of 24 emerging market country indices. The performance of the index is listed in U.S. dollars and assumes reinvestment of net dividends. Net total return indices reinvest dividends after the deduction of withholding taxes, using (for international indices) a tax rate applicable to non-resident institutional investors who do not benefit from double taxation treaties. It is not possible to invest directly in an index.
[40]
3 Since Inception reflects the inception date of the Fund.
[41]
1 Performance shown for the Fund’s Class I and Class L shares reflects the performance of the Class I and Class C shares, respectively, of the Predecessor Fund for periods prior to May 21, 2010.
[42]
2 These returns do not reflect any tax consequences from a sale of your shares at the end of each period.
[43]
3 Class C shares will generally automatically convert to Class A shares eight years after the end of the calendar month in which the shares were purchased. Performance for periods greater than eight years reflects this conversion.
[44]
4 The MSCI All Country World Net Index is a free float-adjusted market capitalization weighted index designed to measure the equity market performance of developed and emerging markets. The term “free float” represents the portion of shares outstanding that are deemed to be available for purchase in the public equity markets by investors. The performance of the index is listed in U.S. dollars and assumes reinvestment of net dividends. Net total return indices reinvest dividends after the deduction of withholding taxes, using (for international indices) a tax rate applicable to non-resident institutional investors who do not benefit from double taxation treaties. It is not possible to invest directly in an index.
[45]
5 Since Inception reflects the inception date of Class I.
[46]
1 These returns do not reflect any tax consequences from a sale of your shares at the end of each period.
[47]
2 Class C shares will generally automatically convert to Class A shares eight years after the end of the calendar month in which the shares were purchased. Performance for periods greater than eight years reflects this conversion.
[48]
3 The MSCI All Country World ex USA Net Index is a free float-adjusted market capitalization weighted index designed to measure the equity market performance of developed and emerging markets, excluding the United States. The term “free float” represents the portion of shares outstanding that are deemed to be available for purchase in the public equity markets by investors. The performance of the index is listed in U.S. dollars and assumes reinvestment of net dividends. Net total return indices reinvest dividends after the deduction of withholding taxes, using (for international indices) a tax rate applicable to non-resident institutional investors who do not benefit from double taxation treaties. It is not possible to invest directly in an index.
[49]
4 Since Inception reflects the inception date of Class I.
[50]
1 These returns do not reflect any tax consequences from a sale of your shares at the end of each period.
[51]
2 Class C shares will generally automatically convert to Class A shares eight years after the end of the calendar month in which the shares were purchased. Performance for periods greater than eight years reflects this conversion.
[52]
3 The MSCI All Country World ex USA Net Index is a free float-adjusted market capitalization weighted index designed to measure the equity market performance of developed and emerging markets, excluding the United States. The term “free float” represents the portion of shares outstanding that are deemed to be available for purchase in the public equity markets by investors. The performance of the index is listed in U.S. dollars and assumes reinvestment of net dividends. Net total return indices reinvest dividends after the deduction of withholding taxes, using (for international indices) a tax rate applicable to non-resident institutional investors who do not benefit from double taxation treaties. It is not possible to invest directly in an index.
[53]
4 Since Inception reflects the inception date of Class I.
[54]
1 These returns do not reflect any tax consequences from a sale of your shares at the end of each period.
[55]
2 The MSCI World Net Index is a free float-adjusted market capitalization weighted index that is designed to measure the global equity market performance of developed markets. The term “free float” represents the portion of shares outstanding that are deemed to be available for purchase in the public equity markets by investors. The MSCI World Net Index currently consists of 23 developed market country indices. The performance of the index is listed in U.S. dollars and assumes reinvestment of net dividends. Net total return indices reinvest dividends after the deduction of withholding taxes, using (for international indices) a tax rate applicable to non-resident institutional investors who do not benefit from double taxation treaties. It is not possible to invest directly in an index.
[56]
3 Since Inception reflects the inception date of the Fund.
[57]
1 These returns do not reflect any tax consequences from a sale of your shares at the end of each period.
[58]
2 The MSCI World Net Index is a free float-adjusted market capitalization weighted index that is designed to measure the global equity market performance of developed markets. The term “free float” represents the portion of shares outstanding that are deemed to be available for purchase in the public equity markets by investors. The MSCI World Net Index currently consists of 23 developed market country indices. The performance of the index is listed in U.S. dollars and assumes reinvestment of net dividends. Net total return indices reinvest dividends after the deduction of withholding taxes, using (for international indices) a tax rate applicable to non-resident institutional investors who do not benefit from double taxation treaties. It is not possible to invest directly in an index.
[59]
3 Since Inception reflects the inception date of the Fund.
[60]
1 These returns do not reflect any tax consequences from a sale of your shares at the end of each period.
[61]
2 The Standard & Poor’s 500® Index (S&P 500® Index) measures the performance of the large cap segment of the U.S. equities market, covering approximately 80% of the U.S. equities market. The S&P 500® Index includes 500 leading companies in leading industries of the U.S. economy. It is not possible to invest directly in an index.
[62]
3 Since Inception reflects the inception date of the Fund.
[63]
1 These returns do not reflect any tax consequences from a sale of your shares at the end of each period.
[64]
2 The Russell 1000® Index measures the performance of the large-cap segment of the U.S. equity universe. It is a subset of the Russell 3000® Index and includes approximately 1,000 of the largest securities based on a combination of their market capitalization and current index membership. The Russell 3000® Index measures the performance of the largest 3,000 U.S. companies representing approximately 98% of the investable U.S. equity market. It is not possible to invest directly in an index.
[65]
3 Since Inception reflects the inception date of Class IR.
[66]
4 The Russell 1000® Growth Index measures the performance of the large-cap growth segment of the U.S. equity universe. It includes those Russell 1000® Index companies with higher price-to-book ratios and higher forecasted growth values. It is not possible to invest directly in an index.
[67]
1 These returns do not reflect any tax consequences from a sale of your shares at the end of each period.
[68]
2 The MSCI All Country World Net Index  is a free float-adjusted market capitalization weighted index designed to measure the equity market performance of developed and emerging markets. The term “free float” represents the portion of shares outstanding that are deemed to be available for purchase in the public equity markets by investors. The performance of the index is listed in U.S. dollars and assumes reinvestment of net dividends. Net total return indices reinvest dividends after the deduction of withholding taxes, using (for international indices) a tax rate applicable to non-resident institutional investors who do not benefit from double taxation treaties. It is not possible to invest directly in an index.
[69]
3 Since Inception reflects the inception date of Class IR.
[70]
1 These returns do not reflect any tax consequences from a sale of your shares at the end of each period.
[71]
2 The MSCI All Country World ex USA Net Index is a free float-adjusted market capitalization weighted index designed to measure the equity market performance of developed and emerging markets, excluding the United States. The term “free float” represents the portion of shares outstanding that are deemed to be available for purchase in the public equity markets by investors. The performance of the index is listed in U.S. dollars and assumes reinvestment of net dividends. Net total return indices reinvest dividends after the deduction of withholding taxes, using (for international indices) a tax rate applicable to non-resident institutional investors who do not benefit from double taxation treaties. It is not possible to invest directly in an index.
[72]
3 Since Inception reflects the inception date of Class IR.
[73]
1 These returns do not reflect any tax consequences from a sale of your shares at the end of each period.
[74]
2 Class C shares will generally automatically convert to Class A shares eight years after the end of the calendar month in which the shares were purchased. Performance for periods greater than eight years reflects this conversion.
[75]
3 The MSCI All Country World ex USA Index is a free float-adjusted market capitalization weighted index designed to measure the equity market performance of developed and emerging markets, excluding the United States. The term “free float” represents the portion of shares outstanding that are deemed to be available for purchase in the public equity markets by investors. The performance of the index is listed in U.S. dollars and assumes reinvestment of net dividends. Returns, including periods prior to January 1, 2001, are calculated using the return data of the MSCI All Country World ex USA Index (gross dividends) through December 31, 2000 and the return data of the MSCI All Country World ex USA Index (net dividends) after December 31, 2000. Net total return indices reinvest dividends after the deduction of withholding taxes, using (for international indices) a tax rate applicable to non-resident institutional investors who do not benefit from double taxation treaties. It is not possible to invest directly in an index.
[76]
4 Since Inception reflects the inception date of Class I.
[77]
5 The Active International Allocation Blend Index is a performance linked benchmark of the old and new benchmark of the Fund, the old benchmark represented by MSCI EAFE Index (index that is designed to measure the international equity market performance of developed markets, excluding the United States and Canada) from the Fund’s inception to December 31, 2016 and the new benchmark represented by MSCI All Country World ex USA Index for periods thereafter. It is not possible to invest directly in an index.
[78]
1 Performance shown for the Fund’s Class I, Class A and Class R6 shares reflects the performance of the limited partnership interests of the Private Fund for periods prior to the Emerging Markets Leaders Reorganization, adjusted to reflect any applicable sales charge of the class, but not adjusted for any other differences in expenses. If adjusted for other expenses, returns would be different.
[79]
2 These returns do not reflect any tax consequences from a sale of your shares at the end of each period.
[80]
3 Class C shares will generally automatically convert to Class A shares eight years after the end of the calendar month in which the shares were purchased. Performance for periods greater than eight years reflects this conversion.
[81]
4 The MSCI Emerging Markets Net Index is a free float-adjusted market capitalization weighted index that is designed to measure equity market performance of emerging markets. The term “free float” represents the portion of shares outstanding that are deemed to be available for purchase in the public equity markets by investors. The MSCI Emerging Markets Net Index currently consists of 24 emerging market countries. The performance of the index is listed in U.S. dollars and assumes reinvestment of net dividends. Net total return indices reinvest dividends after the deduction of withholding taxes, using (for international indices) a tax rate applicable to non-resident institutional investors who do not benefit from double taxation treaties. It is not possible to invest directly in an index.
[82]
5 Since Inception reflects the inception date of Class I.
[83]
1 These returns do not reflect any tax consequences from a sale of your shares at the end of each period.
[84]
2 Class C shares will generally automatically convert to Class A shares eight years after the end of the calendar month in which the shares were purchased. Performance for periods greater than eight years reflects this conversion.
[85]
3 The MSCI Emerging Markets Net Index is a free float-adjusted market capitalization weighted index that is designed to measure equity market performance of emerging markets. The term “free float” represents the portion of shares outstanding that are deemed to be available for purchase in the public equity markets by investors. The MSCI Emerging Markets Net Index currently consists of 24 emerging market countries. The performance of the index is listed in U.S. dollars and assumes reinvestment of net dividends. Net total return indices reinvest dividends after the deduction of withholding taxes, using (for international indices) a tax rate applicable to non-resident institutional investors who do not benefit from double taxation treaties. It is not possible to invest directly in an index.
[86]
4 Since Inception reflects the inception date of Class I.
[87]
1 These returns do not reflect any tax consequences from a sale of your shares at the end of each period.
[88]
2 The MSCI All Country World ex USA Index is a free float-adjusted market capitalization weighted index designed to measure the equity market performance of developed and emerging markets, excluding the United States. The term “free float” represents the portion of shares outstanding that are deemed to be available for purchase in the public equity markets by investors. The performance of the index is listed in U.S. dollars and assumes reinvestment of net dividends. Net total return indices reinvest dividends after the deduction of withholding taxes, using (for international indices) a tax rate applicable to non-resident institutional investors who do not benefit from double taxation treaties. It is not possible to invest directly in an index.
[89]
3 Since Inception reflects the inception date of Class IR.
[90]
1 These returns do not reflect any tax consequences from a sale of your shares at the end of each period.
[91]
2 The MSCI Emerging Markets Net Index is a free float-adjusted market capitalization weighted index that is designed to measure equity market performance of emerging markets. The term “free float” represents the portion of shares outstanding that are deemed to be available for purchase in the public equity markets by investors. The MSCI Emerging Markets Net Index currently consists of 24 emerging market countries. The performance of the index is listed in U.S. dollars and assumes reinvestment of net dividends. Net total return indices reinvest dividends after the deduction of withholding taxes, using (for international indices) a tax rate applicable to non-resident institutional investors who do not benefit from double taxation treaties. It is not possible to invest directly in an index.
[92]
3 Since Inception reflects the inception date of Class IR.
[93]
1 These returns do not reflect any tax consequences from a sale of your shares at the end of each period.
[94]
2 The MSCI Emerging Markets Index is a free float-adjusted market capitalization weighted index that is designed to measure equity market performance of emerging markets. The term “free float” represents the portion of shares outstanding that are deemed to be available for purchase in the public equity markets by investors. The  MSCI Emerging Markets Index currently consists of 24 emerging market countries. The performance of the index is listed in  U.S. dollars and assumes reinvestment of net dividends. Net total return indices reinvest dividends after the deduction of withholding taxes, using (for international indices) a tax rate applicable to non-resident institutional investors who do not benefit from double taxation treaties. It is not possible to invest directly in an index.
[95]
3 Since Inception reflects the inception date of Class IR.
[96]
1 These returns do not reflect any tax consequences from a sale of your shares at the end of each period.
[97]
2 Class C shares will generally automatically convert to Class A shares eight years after the end of the calendar month in which the shares were purchased. Performance for periods greater than eight years reflects this conversion.
[98]
3 The MSCI World Net Index is a free float-adjusted market capitalization weighted index that is designed to measure the global equity market performance of developed markets. The term “free float” represents the portion of shares outstanding that are deemed to be available for purchase in the public equity markets by investors. The MSCI World Net Index currently consists of 23 developed market country indices. The performance of the index is listed in U.S. dollars and assumes reinvestment of net dividends. Net total return indices reinvest dividends after the deduction of withholding taxes, using (for international indices) a tax rate applicable to non-resident institutional investors who do not benefit from double taxation treaties. It is not possible to invest directly in an index.
[99]
4 Since Inception reflects the inception date of Class I.
[100]
1 These returns do not reflect any tax consequences from a sale of your shares at the end of each period.
[101]
2 Class C shares will generally automatically convert to Class A shares eight years after the end of the calendar month in which the shares were purchased. Performance for periods greater than eight years reflects this conversion.
[102]
3 The MSCI All Country World Net Index  is a free float-adjusted market capitalization weighted index designed to measure the equity market performance of developed and emerging markets. The term “free float” represents the portion of shares outstanding that are deemed to be available for purchase in the public equity markets by investors. The performance of the index is listed in U.S. dollars and assumes reinvestment of net dividends. Net total return indices reinvest dividends after the deduction of withholding taxes, using (for international indices) a tax rate applicable to non-resident institutional investors who do not benefit from double taxation treaties. It is not possible to invest directly in an index.
[103]
4 Since Inception reflects the inception date of Class I.
[104]
5 The MSCI World/MSCI All Country World Blended Index is a performance linked benchmark of the old and new benchmark of the Fund. The old benchmark represented by MSCI World Index (benchmark that is designed to measure the global equity market performance of developed markets) for periods from the Fund’s inception to June 26, 2024 and the new benchmark represented by  MSCI All Country World Index for periods thereafter. It is not possible to invest directly in an index.
[105]
1 These returns do not reflect any tax consequences from a sale of your shares at the end of each period.
[106]
2 Class C shares will generally automatically convert to Class A shares eight years after the end of the calendar month in which the shares were purchased. Performance for periods greater than eight years reflects this conversion.
[107]
3 The MSCI EAFE Index (Europe, Australasia, Far East) is a free float-adjusted market capitalization index that is designed to measure the international equity market performance of developed markets, excluding the United States and Canada. The term “free float” represents the portion of shares outstanding that are deemed to be available for purchase in the public equity markets by investors. The MSCI EAFE Index currently consists of 21 developed market country indices. The performance of the index is listed in U.S. dollars and assumes reinvestment of net dividends. Net total return indices reinvest dividends after the deduction of withholding taxes, using (for international indices) a tax rate applicable to non-resident institutional investors who do not benefit from double taxation treaties. It is not possible to invest directly in an index.
[108]
4 Since Inception reflects the inception date of Class I.
[109]
1 These returns do not reflect any tax consequences from a sale of your shares at the end of each period.
[110]
2 The MSCI All Country World ex USA Net Index is a free float-adjusted market capitalization weighted index designed to measure the equity market performance of developed and emerging markets, excluding the United States. The term “free float” represents the portion of shares outstanding that are deemed to be available for purchase in the public equity markets by investors. The performance of the index is listed in U.S. dollars and assumes reinvestment of net dividends. Net total return indices reinvest dividends after the deduction of withholding taxes, using (for international indices) a tax rate applicable to non-resident institutional investors who do not benefit from double taxation treaties. It is not possible to invest directly in an index.
[111]
3 Since Inception reflects the inception date of Class I.