| Fund | Costs of a $10,000 Investment | Costs Paid as a Percentage of a $10,000 Investment |
|---|---|---|
| IPS Strategic Capital Absolute Return Fund | $153 | 1.47% |
The Fund's overall performance has been strong for the fiscal year ended February 28, 2026, driven by the deliberate construction of a portfolio that combines high positive gamma with low net theta cost — a pairing that is structurally rare and operationally difficult to maintain, but one that delivered meaningful advantages across the full range of market conditions experienced during the year. By simultaneously managing vega exposure as a dynamic variable rather than a static byproduct, the Adviser was able to respond to shifting volatility regimes in real time, positioning the portfolio to benefit whether the market was pricing fear in or pricing it out.
High Gamma, Low Theta — The Core Structural Advantage
Conventional options portfolios force a tradeoff: high positive gamma — the mechanism that causes a portfolio's market sensitivity to rise in rallies and fall in drawdowns — typically comes at the cost of significant time decay. Owning gamma means paying theta. For most funds, that theta drag becomes a persistent headwind that erodes returns in quiet, range-bound markets.
The Adviser structured the portfolio to break this tradeoff. By financing long gamma exposure through the strategic use of Treasury Bills and OCC-cleared box spreads — which monetize prevailing interest rates to fund synthetic long positions in calls and puts — the portfolio maintained robust positive gamma without bearing the full theta burden that would ordinarily accompany it. The result was a portfolio that could participate aggressively in directional moves in either direction while incurring minimal time-decay cost during periods of low realized volatility.
Additionally, the Adviser employed put bear ratio spreads when elevated VIX levels justified the structure. These spreads generate positive theta — meaning the portfolio actually earns time decay rather than paying it — while simultaneously providing downside protection through negative delta. This use of elevated implied volatility to harvest premium converted what is normally a cost center (downside hedging) into a net contributor to daily carry. The combination of financed long gamma and positive theta from ratio spreads allowed the Fund to achieve a risk profile that is additive across multiple market environments simultaneously.
Dynamic Vega Management — Rebalancing to the VIX
Vega — the portfolio's sensitivity to changes in implied volatility — was managed as an active lever, not a residual. The Adviser's approach treats the VIX not merely as a fear gauge but as a pricing signal that determines where vega exposure should be concentrated, reduced, or restructured entirely.
When the VIX was elevated, the portfolio was positioned with a net short vega bias in the near term: implied volatility was high relative to realized volatility, making it advantageous to be a seller of premium at the margin. The put bear ratio spreads described above are one expression of this — by overwriting into elevated vol, the Adviser collected inflated premium while retaining the long gamma core that provides structural protection against a genuine tail event.
When the VIX compressed toward lower levels, the Adviser reduced short vega exposure and allowed the long gamma structure to express itself more fully. In low-volatility environments, long gamma becomes cheaper to carry relative to its payoff in a volatility expansion — so the portfolio was positioned to benefit from a mean-reversion spike while not sacrificing daily carry to do so.
This continuous rebalancing of vega to the level of the VIX created a portfolio that was, in effect, its own volatility regime manager. Rather than being caught long vega into a vol crush or short vega into a spike, the structure adapted. The gamma profile ensured that delta — and therefore beta — automatically adjusted with market direction, while the vega rebalancing ensured that the portfolio's sensitivity to changes in implied volatility was always calibrated to what the market was offering.
Beta Management as an Output, Not an Input
One consequence of maintaining a high positive gamma portfolio is that beta management becomes largely self-executing. Gamma is the mechanism by which a portfolio's market sensitivity rises during uptrends and falls during downtrends — precisely the behavior an active manager would want to engineer manually. The Adviser reinforced this by actively monitoring and rebalancing beta at key inflection points, increasing exposure during early-stage rebounds and reducing it as momentum matured. This prevented the Fund from being caught in the momentum traps that penalize static or trend-following strategies at cycle turns.
Conclusion
The successful integration of high positive gamma, low net theta, and dynamically rebalanced vega produced a portfolio that captured more of the upside during market rallies, limited drawdown exposure during dislocations, and maintained positive carry across the range of volatility environments encountered during the year. The Fund ranked above the median of its comparable peer group — an outcome that reflects not a single favorable market condition but a structural approach designed to perform across conditions.
The Adviser remains committed to this framework, and will continue to calibrate vega, gamma, and theta positioning to the prevailing opportunity set as volatility regimes evolve.
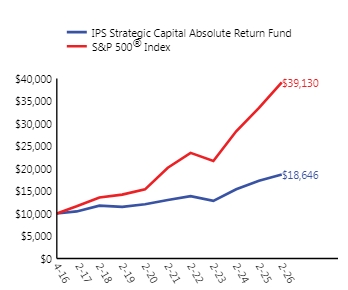
| One Year | Five Years | Inception (04/15/2016) | |
|---|---|---|---|
| IPS Strategic Capital Absolute Return Fund | 8.04% | 7.50% | 6.51% |
| S&P 500® Index | 16.99% | 14.19% | 14.82% |
| Net Assets ($) | $52,494,426 |
|---|---|
| Number of Portfolio Holdings | |
| Portfolio Turnover Rate (%) | 116% |
| Total Advisory Fees Paid ($) | $521,035 |
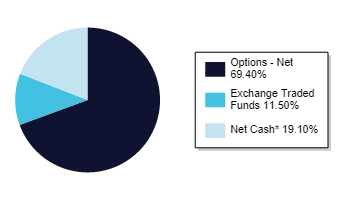
* Net Cash represents money market funds and other assets in excess of liabilities.