The following is a map of Japan, illustrating its location with respect to neighboring countries:
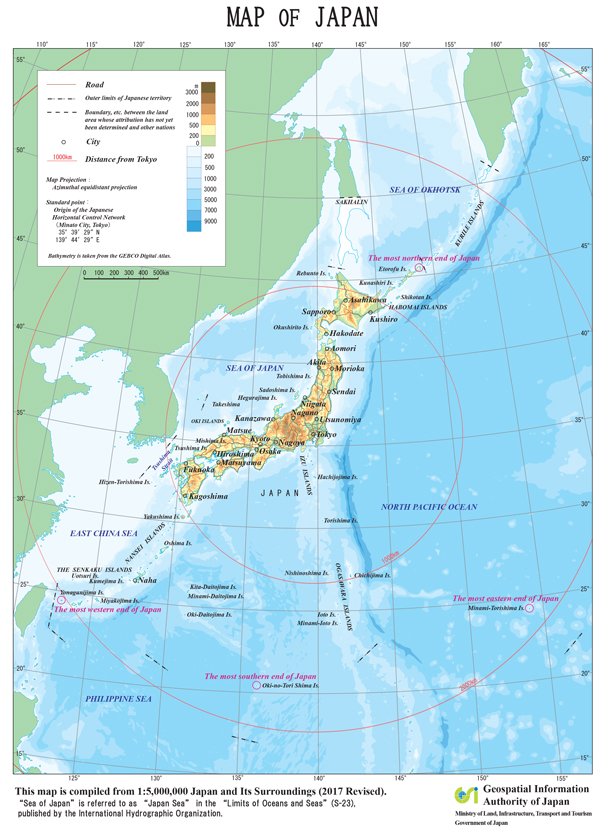
7
Exhibit 1
Japan
This description of Japan is dated August 6, 2026, and appears as Exhibit 1 to Japan’s Annual Report on Form 18-K to the U.S. Securities and Exchange Commission (the “Commission”) for the fiscal year ended March 31, 2026.
1
THE DELIVERY OF THIS DOCUMENT AT ANY TIME DOES NOT IMPLY THAT THE INFORMATION IS CORRECT AS OF ANY TIME SUBSEQUENT TO ITS DATE. THIS DOCUMENT (OTHERWISE THAN AS PART OF A PROSPECTUS CONTAINED IN A REGISTRATION STATEMENT FILED UNDER THE U.S. SECURITIES ACT OF 1933) DOES NOT CONSTITUTE AN OFFER TO SELL OR THE SOLICITATION OF AN OFFER TO BUY ANY SECURITIES OF OR GUARANTEED BY JAPAN.
TABLE OF CONTENTS
| GENERAL |
4 | |||
| Area and Population |
4 | |||
| Government |
4 | |||
| Political Parties |
4 | |||
| Leadership |
5 | |||
| International Organizations |
5 | |||
| International Trade Agreements |
6 | |||
| THE ECONOMY |
8 | |||
| General |
8 | |||
| Summary of Key Economic Indicators |
11 | |||
| Gross Domestic Product and National Income |
12 | |||
| Industry |
14 | |||
| Energy |
14 | |||
| Price Indices |
16 | |||
| Labor |
16 | |||
| Aging Workforce and Population Decrease |
19 | |||
| FOREIGN TRADE AND BALANCE OF PAYMENTS |
21 | |||
| Foreign Trade |
21 | |||
| Balance of Payments |
24 | |||
| Foreign Exchange Rates |
25 | |||
| Foreign Direct Investment |
25 | |||
| FINANCIAL SYSTEM |
29 | |||
| The Bank of Japan and Monetary Policy |
29 | |||
| Government Financial Institutions |
29 | |||
| Private Financial Institutions |
30 | |||
| GOVERNMENT FINANCE |
31 | |||
| Revenues, Expenditures and Budgets |
31 | |||
| Tax Structure |
36 | |||
| Fiscal Investment and Loan Program |
36 | |||
| DEBT RECORD |
38 | |||
| JAPAN’S PUBLIC DEBT |
38 | |||
| INTERNAL DEBT |
39 | |||
| Direct Debt of the Japanese Government |
39 | |||
| Debt Guaranteed by the Japanese Government |
42 | |||
| EXTERNAL DEBT |
43 | |||
| Debt Guaranteed by the Japanese Government |
43 | |||
| SUBSCRIPTIONS TO INTERNATIONAL FINANCIAL ORGANIZATIONS |
44 |
2
FURTHER INFORMATION
This document appears as an exhibit to Japan’s Annual Report filed with the Commission on Form 18-K for the fiscal year ended March 31, 2026. Additional information with respect to Japan is available in such Annual Report, in the other exhibits to such Annual Report and in amendments thereto. Such Annual Report, exhibits and amendments may be inspected and copied at the public reference room maintained by the Commission at: 100 F Street, N.E., Washington, D.C. 20549. Information regarding the operations of the public reference room can be obtained by calling the Commission at 1-800-SEC-0330. The Annual Report and its exhibits and amendments are also available through the Commission’s Internet website at http://www.sec.gov.
In this document all amounts are expressed in Japanese Yen (“¥” or “yen”), except as otherwise specified. The spot buying rate quoted on the Tokyo Foreign Exchange Market on July 31, 2026 as reported by the Bank of Japan (the “BOJ”) at 5:00 p.m., Tokyo time, was ¥160.21=$1.00, and the noon buying rate on July 24, 2026 for cable transfers in New York City payable in yen, as reported by the Federal Reserve Bank of New York, was ¥163.71=$1.00. See “Foreign Trade and Balance of Payments — Foreign Exchange Rates”.
References herein to Japanese fiscal years (“JFYs”) are to 12-month periods commenced or commencing in each case on April 1 of the year indicated and ended or ending on March 31 of the following year. References to years not specified as being JFYs are to calendar years.
3
Japan
Japan, an archipelago in the western Pacific, consists of four main islands (Hokkaido, Honshu, Kyushu and Shikoku) which are mostly mountainous located in the same approximate range of latitude as the east coast of the United States north of Florida. The total area of Japan is approximately 146,000 square miles, which is slightly less than that of California and about 4% of the United States. It is bordered by the Sea of Japan to the west and north, and by the Pacific Ocean to the east and south.
Japan has a total population of approximately 123 million (estimated as of July 1, 2026). It has one of the highest population densities in the world and approximately 24.8% of its people (estimated as of October 1, 2025) are concentrated in three metropolitan areas (Tokyo, Osaka and Nagoya). Japan’s rate of population decrease during the years 2021-2025 was 1.8%. Japan’s population decreased 0.5% during the 12 months ended October 1, 2025 (estimated as of October 1, 2025).
The legislative power in Japan is vested in the Diet, which currently consists of a House of Representatives having 465 members and a House of Councillors having 248 members. Members of both houses are elected by direct universal suffrage, except that some members of each house are elected by proportional representation. The power of the House of Representatives is superior to that of the House of Councillors in respect of approving certain matters including the national budget and electing the Prime Minister.
The executive power is vested in the Cabinet consisting of a Prime Minister, elected by the Diet from among its members, and other Ministers appointed by the Prime Minister, a majority of whom must be members of the Diet. The judicial power is vested in the Supreme Court and such lower courts as are established by law.
Japan’s 47 prefectures, and its cities, towns and villages, have a certain degree of local autonomy through popularly elected legislative bodies and chief executives. The central government exercises its influence on local governments indirectly through financial aid and prescribing standards of local administration.
Members of the House of Representatives are elected for four-year terms unless the House of Representatives is dissolved prior to expiration of their terms. The House of Representatives was dissolved on January 23, 2026 and an election was held on February 8, 2026. 289 members were elected from single-member districts and 176 members were elected through a proportional representation process from 11 regional districts. Pursuant to a revision of the Public Offices Election Act in July 2018, the number of seats in the House of Councillors was increased to 248 from 242. The members are elected for six-year terms with one-half of the membership being elected every three years. In an election in July 2025, 125 members were elected, of which 50 members were elected through a proportional representation system and 75 members, including a member to fill a vacancy, were elected from 45 districts that correspond to the 47 prefectures of Japan. Currently, the House of Councillors consists of 124 members whose term expires in July 2028 and 124 members whose term expires in July 2031.
4
The following tables set forth the membership by political party of the House of Representatives as of July 30, 2026 and the House of Councillors as of July 30, 2026.
| House of Representatives |
||||
| Liberal Democratic Party |
316 | |||
| Centrist Reform Alliance |
48 | |||
| Nippon Ishin (Japan Innovation Party) |
36 | |||
| Democratic Party For the People |
28 | |||
| SANSEITO |
15 | |||
| Team Mirai |
11 | |||
| Japanese Communist Party |
4 | |||
| Independents |
7 | |||
| Vacancies |
0 | |||
|
|
|
|||
| Total |
465 | |||
|
|
|
|||
Source: House of Representatives.
| House of Councillors |
||||
| Liberal Democratic Party and Group of Independents |
101 | |||
| The Constitutional Democratic Party of Japan and the Independent |
40 | |||
| Democratic Party For the People and The Shin-Ryokufukai |
25 | |||
| Komeito |
21 | |||
| Nippon Ishin (Japan Innovation Party) |
19 | |||
| SANSEITO |
15 | |||
| Japanese Communist Party |
7 | |||
| REIWA SHINSENGUMI |
5 | |||
| Conservative Party of Japan |
2 | |||
| Okinawa Whirlwind |
2 | |||
| Team Mirai and the Independent |
2 | |||
| Social Democratic Party |
2 | |||
| Independents |
6 | |||
| Vacancies |
1 | |||
|
|
|
|||
| Total |
248 | |||
|
|
|
|||
Source: House of Councillors.
Japan’s current Prime Minister is TAKAICHI Sanae, a member of the Liberal Democratic Party of Japan and member of the House of Representatives in the Diet. TAKAICHI Sanae was elected as Japan’s 104th Prime Minister on October 21, 2025, succeeding the former Prime Minister ISHIBA Shigeru. On February 18, 2026, TAKAICHI Sanae was re-elected as Japan’s 105th Prime Minister.
Japan is a member of the United Nations and other international organizations, including the International Monetary Fund, International Bank for Reconstruction and Development, International Development Association, International Finance Corporation, Multilateral Investment Guarantee Agency, Asian Development Bank, Inter-American Development Bank, Multilateral Investment Fund, Inter-American Investment Corporation, African Development Bank, African Development Fund, European Bank for Reconstruction and Development and International Fund for Agricultural Development. See “Subscriptions to International Financial Organizations”.
5
International Trade Agreements
Japan signed an agreement to join the Trans Pacific Partnership, or TPP, on February 4, 2016. Upon the ratification of the TPP, Japan and the other participating countries planned to not only eliminate tariffs on products but also liberalize services and investment, and establish rules in a wide range of fields, including intellectual property, e-commerce and the environment. Although Japan ratified the TPP on January 20, 2017, the United States announced its formal withdrawal from the TPP on January 23, 2017. On March 8, 2018, Japan and ten other countries excluding the United States signed the Comprehensive and Progressive Agreement for Trans-Pacific Partnership, or CPTPP, pursuant to which each signatory country agreed to start the necessary preparations for the implementation of the TPP. The CPTPP entered into force for Japan, Mexico, Singapore, New Zealand, Canada, and Australia on December 30, 2018, for Vietnam on January 14, 2019, for Peru on September 19, 2021, for Malaysia on November 29, 2022, for Chile on February 21, 2023 and for Brunei on July 12, 2023. On February 1, 2021, the United Kingdom formally applied to join the CPTPP. On March 31, 2023, the United Kingdom and the members of the CPTTP concluded negotiations on the United Kingdom’s accession to the CPTPP. On July 16, 2023, the members of the CPTTP formally approved the United Kingdom’s application for membership. The United Kingdom’s accession to the CPTPP became effective on December 15, 2024, with respect to the eight member countries (Japan, Singapore, Chile, New Zealand, Vietnam, Peru, Malaysia and Brunei), on December 24, 2024 with respect to Australia, on June 22, 2026 with respect to Mexico, and will enter into force for trade with Canada 60 days after Canada ratifies.
Japan has also entered into Economic Partnership Agreements, or EPAs, with various countries, including Singapore, Mexico, Malaysia, Chile and Thailand. As of February 2026, Japan had entered into a total of 22 EPAs (including the TPP) with 51 countries and regions. Pursuant to the EPAs, Japan will collaborate comprehensively with the counterparties to, among other things, reduce or eliminate tariffs, grant most-favored-nation status in the fields of investment, services and government procurement and expedite patent review and enhance patent protection in the field of intellectual property.
Japan is also a member of international organizations which are based on international trade treaties and other agreements which seek to promote free trade in the international market, including the following: the World Trade Organization, the Organization for Economic Co-operation and Development, the World Customs Organization and the International Trade Centre.
6
The following is a map of Japan, illustrating its location with respect to neighboring countries:
7
Japan has a highly advanced and diversified economy, which has developed in response to changing conditions in Japan and the world. During the period of high economic growth in the 1960s and the early 1970s, the expansion was based on the development of heavy industries consuming large quantities of resources. During the 1980s, there was rapid growth in high value-added industries, such as electronics and precision instruments, which employ high level technology and consume relatively low quantities of resources. The service sector of the economy grew significantly during the 1980s and 1990s.
Although the Japanese economy expanded from 2002 to 2007, Japan continued to face several domestic economic challenges even before the 2008 global financial crisis. The subsequent recovery relied less on domestic consumption than in previous growth periods, and average wages remained largely stagnant despite improving labor market conditions. Globally competitive manufacturers benefited from strong external demand, whereas small and medium-sized enterprises and non-manufacturing sectors saw only limited improvements in productivity and profitability. As a result, the strength of the economic recovery varied across regions in Japan. In the longer term, Japan faced structural challenges, including population decline, the retirement of the baby-boom generation, environmental and energy-conservation issues, and fiscal deficits. Against this backdrop, the United States subprime mortgage crisis and rising energy and raw material prices weakened the global economy and contributed to a deterioration in Japan’s economy. Throughout JFY 2008, the global economy worsened, as failures of major U.S. financial institutions led to tighter credit conditions, market volatility, declining consumer confidence and reduced business activities worldwide. Japan was particularly affected by the weaker global demand and the appreciation of the yen, which hit its export sector. Japan entered a recession after February 2008, but the economy picked up in JFY 2010, despite persistently high unemployment rate.
On March 11, 2011, just as the Japanese economy was transitioning from stagnation to recovery, the Great East Japan Earthquake (the “Earthquake”) and the accompanying nuclear accident at the Fukushima Daiichi Nuclear Power Station struck Japan, causing the economy to post negative growth in the first and second quarters of 2011. Consumer sentiment deteriorated sharply, while the shutdown of damaged factories, supply-chain disruptions and power supply constraints weighed heavily on production, most notably in the auto industry, which depended on the Tohoku region for key parts. The nuclear accident also chilled activities in sectors such as tourism and leisure. Separately, severe flooding in Thailand at the end of July 2011 suspended local factory operations and reduced Japan’s exports of intermediary materials, further weighing on the economy. In response to the Earthquake, the Government of Japan compiled a series of supplementary budgets totaling approximately ¥18 trillion between May 2011 and February 2012. Additional reconstruction budgets totaling approximately ¥13 trillion in aggregate were subsequently approved for JFY 2012 through JFY 2014. Although these efforts facilitated a rapid recovery of supply chains, the subsequent rapid appreciation of the yen and the European sovereign debt crisis kept the recovery to a modest level.
In December 2012, the Government of Japan announced “Abenomics” (named after the former Prime Minister ABE Shinzo), an economic strategy combining an expansionary monetary policy, a flexible fiscal policy and an economic growth agenda that promotes private investment, with the goal of achieving GDP growth and job creation. As part of this strategy, the Government of Japan and the BOJ issued a joint statement in January 2013 announcing measures to overcome deflation and achieve sustainable economic growth with price stability, and in April 2013, under newly appointed governor of the BOJ KURODA Haruhiko, the BOJ introduced its quantitative and qualitative monetary easing policy aimed at achieving a 2% price stability target in terms of the year-on-year rate of change in the consumer price index at the earliest possible time (the “QQE”). Supported in part by these policy measures, the Japanese economy experienced a sustained recovery from late 2012 through 2018, marking one of the longest postwar expansions, with corporate earnings and employment improving steadily. The Japanese Diet also passed comprehensive social security and tax reform, under which the consumption tax rate was increased from 5% to 8% in April 2014 and, after being postponed, from 8% to 10% in October 2019. As part of the same tax reform, the effective corporate tax rate was progressively reduced from 34.62% to 29.74% over JFY 2015 through JFY 2018 to enhance the competitiveness of Japanese businesses.
The Japanese economy remained generally firm through much of 2019 amid continued accommodative policy conditions and improvements in employment and corporate earnings. However, real GDP contracted by 2.9% quarter-on-quarter in the fourth quarter of 2019, reflecting the temporary effect of the consumption tax rate increase in October. The expected rebound in the first quarter of 2020 was limited in scale due to the onset of the COVID-19 pandemic, which began with the first confirmed domestic case on January 15, 2020 and placed the Japanese economy under unprecedented strain. Following the declaration of a state of emergency on April 7, 2020, initially covering seven prefectures and expanded nationwide on April 16, restraints on social and economic activities caused real GDP to contract by 7.2% (26.0% on an annualized basis) in the second quarter of 2020, the sharpest post-war decline, with real GDP for calendar year 2020 falling by 4.3%. In response, the Government of Japan compiled successive supplementary budgets providing extensive fiscal support to households, businesses and the medical system. Real GDP rebounded sharply through the second half of 2020 and by the first quarter of 2021 recovered to its post-tax-increase level of the fourth quarter of 2019. However, repeated declarations of states of emergency and implementation of quasi-emergency measures led to an uneven trajectory thereafter, and the pre-tax-increase peak of the third quarter of 2019 was not regained until early 2023. By the time COVID-19 was reclassified as a Category V infectious disease under the Infectious Diseases Control Act on May 8, 2023, the economic impact of the pandemic had largely subsided.
8
Following an extended period of deflationary or stagnant prices, Japan experienced a significant inflationary trend beginning in 2022, driven primarily by the recovery in global demand following the COVID-19 pandemic, the surge in global energy and raw material prices triggered by Russia’s invasion of Ukraine in February 2022, and the subsequent depreciation of the yen. The consumer price index (the “CPI”), all items, rose by 2.5% in calendar year 2022, by 3.2% in 2023 and by 2.7% in 2024. Wage growth initially failed to keep pace with the acceleration of inflation in 2022 and remained modest in 2023, but signs of a virtuous cycle between wages and prices subsequently began to emerge, supported by intensified collective bargaining negotiations (the “Shunto”) and the steady pass-through of higher costs to selling prices. According to the Japanese Trade Union Confederation (Rengo), the aggregate wage increase reached 5.10% in the 2024 Shunto, exceeding 5% for the first time in over three decades, 5.25% in the 2025 Shunto, the highest level since 1991, and moderated slightly to 5.01% in the 2026 Shunto. As inflation became more firmly established and signs of a virtuous cycle between wages and prices strengthened, the BOJ revised its monetary policy framework in March 2024 under Governor UEDA Kazuo, who had taken office in April 2023. The revision marked the end of QQE with Yield Curve Control and the adoption of a framework centered on the short-term policy rate. Under this framework, the BOJ conducts monetary policy as appropriate with a view to achieving its 2% price stability target in a sustainable and stable manner.
In 2025, the United States implemented a series of new tariff measures, including reciprocal tariffs on imports from many trading partners and sector-specific tariffs on automobiles and auto parts. On July 22, 2025, Japan and the United States announced a framework agreement under which the United States would apply a baseline 15% tariff, inclusive of the most-favored-nation rate, to most Japanese imports, with separate treatment for certain sector-specific products, while Japan agreed to support investment of $550 billion in strategic sectors in the United States and to expand purchases of agricultural and energy products from the United States. The agreement was implemented by a United States Executive Order on September 4, 2025, with the new reciprocal tariff rate becoming applicable to entries from August 7, 2025 and the reduced tariff on automobiles and auto parts taking effect on September 16, 2025. The macroeconomic impact on Japan has so far been relatively limited, owing principally to Japanese automakers initially adjusting their export prices in response to the new tariff measures, the predictability provided by the bilateral framework agreement, and the continued resilience of non-automotive export sectors. Following the United States Supreme Court’s February 20, 2026 decision on the IEEPA-based reciprocal tariffs, the United States adopted alternative tariff measures, including a time-limited 10% duty under Section 122 of the Trade Act of 1974, while expanding investigations under Section 301 of the same Act and continuing sector-specific investigations under Section 232 of the Trade Expansion Act of 1962.
9
According to the Monthly Economic Report published by the Cabinet Office of Japan on June 30, 2026, the Japanese economy is recovering at a moderate pace, while attention should be given to the effects caused by the situation in the Middle East. Private consumption shows movements of picking up, business investment is picking up, exports recently show movements of picking up in part reflecting, the employment situation shows movements of improvement and consumer prices have been rising moderately. The recovery in exports has been supported in part by strong global demand for AI-related and semiconductor products. Under the FY2026 Economic Outlook approved by the Cabinet on January 23, 2026, the Government of Japan projects, for JFY 2026, nominal GDP growth of approximately 3.4% and real GDP growth of approximately 1.3%, with the year-on-year rate of increase in the CPI (all items) projected at approximately 1.9%. The CPI projection does not fully reflect the potential impact of the situation in the Middle East, and developments therein, together with fluctuations in the financial and capital markets, warrant continued attention.
The Japanese economy faces certain challenges, as further described herein. Long-term structural challenges include demographic challenges such as the decline in the labor force due to the aging and decreasing population, the high levels of public debt and associated debt servicing payments, and a relatively low potential growth rate. To address these challenges, the Government of Japan intends to advance economic and fiscal management under the concept of “responsible and proactive public finances” while ensuring market confidence, and to promote “strategic investments that enhance resilience against potential crises” and “growth-oriented investment” across strategic sectors as the centerpiece of the Japan Growth Strategy. In the near term, the Japanese economy is also exposed to challenges arising from trade tensions involving major trading partners, inter-state competition, risks to the stable supply of critical goods and resources, natural disasters, and the potential escalation of geopolitical risks, all of which may negatively affect Japan’s international trade and economy more generally.
10
Summary of Key Economic Indicators
The following tables set forth information regarding certain of Japan’s key economic indicators for the periods indicated:
| JFY 2021 | JFY 2022 | JFY 2023 | JFY 2024 | JFY 2025 | ||||||||||||||||
| (yen amounts in billions, except percentages and index) | ||||||||||||||||||||
| Percentage Changes of GDP from Previous Year |
||||||||||||||||||||
| At Nominal Prices |
4.0 | % | 2.6 | % | 4.7 | % | 3.7 | % | 4.1 | % | ||||||||||
| At Real Prices(a) |
3.9 | 1.4 | (0.0 | ) | 0.5 | 0.8 | ||||||||||||||
| Total Revenues of Consolidated General and Special Accounts(b) |
¥ | 322,651 | ¥ | 305,266 | ¥ | 274,337 | ¥ | 284,612 | ¥ | 293,746 | ||||||||||
| Total Expenditures of Consolidated General and Special Accounts(b) |
285,348 | 269,810 | 248,820 | 255,367 | 285,356 | |||||||||||||||
| Surplus of Consolidated Revenues over Consolidated Expenditures(b) |
37,303 | 35,456 | 25,517 | 29,245 | 8,390 | |||||||||||||||
| Public Debt |
1,037,735 | 1,072,905 | 1,107,223 | 1,137,675 | 1,159,660 | |||||||||||||||
| (a) | Real prices are based on calendar year 2020. |
| (b) | The data for JFY 2025 is the provisional results as of December 31, 2025. |
Source: Economic and Social Research Institute; Cabinet Office; and Ministry of Finance.
| 2021 | 2022 | 2023 | 2024 | 2025 | ||||||||||||||||
| (yen or dollar amounts in billions, except percentages and index) | ||||||||||||||||||||
| Unemployment Rate |
2.8 | % | 2.6 | % | 2.6 | % | 2.5 | % | 2.5 | % | ||||||||||
| Consumer Price Index(a) |
99.8 | 102.3 | 105.6 | 108.5 | 111.9 | |||||||||||||||
| Annual Change |
(0.2 | )% | 2.5 | % | 3.2 | % | 2.7 | % | 3.2 | % | ||||||||||
| Corporate Goods Price Index(b) |
104.6 | 114.9 | 119.9 | 122.8 | 126.7 | |||||||||||||||
| Annual Change |
4.6 | % | 9.8 | % | 4.4 | % | 2.4 | % | 3.2 | % | ||||||||||
| Current Account regarding Balance of Payments |
¥ | 21,467 | ¥ | 11,443 | ¥ | 22,476 | ¥ | 29,277 | ¥ | 32,235 | ||||||||||
| Official Foreign Exchange Reserves |
$ | 1,406 | $ | 1,228 | $ | 1,295 | $ | 1,231 | $ | 1,370 | ||||||||||
| (a) | Calendar year 2020=100. |
| (b) | Calendar year 2020=100. Indices are calculated using the monthly averages. |
Source: Ministry of Internal Affairs and Communications “Labor Force Survey”; Consumer Price Index, Statistics Bureau, Ministry of Internal Affairs and Communications; Domestic Corporate Goods Price Index, Bank of Japan; and Ministry of Finance.
11
Gross Domestic Product and National Income
The following table sets forth information pertaining to Japan’s gross domestic product for JFY 2021 through JFY 2025. Nominal GDP increased by 4.1% during JFY 2025, and the annual growth rate of real GDP was 0.8%.
Gross Domestic Product(a)
| JFY 2021 | JFY 2022 | JFY 2023 | JFY 2024 | JFY 2025 | Percentage of JFY 2025 GDP |
|||||||||||||||||||
| (yen amounts in billions) | ||||||||||||||||||||||||
| Total Consumption |
||||||||||||||||||||||||
| Private sectors |
¥ | 305,142 | ¥ | 323,865 | ¥ | 330,860 | ¥ | 340,185 | ¥ | 353,602 | 52.8 | % | ||||||||||||
| Public sectors |
119,065 | 122,377 | 123,448 | 129,100 | 132,626 | 19.8 | ||||||||||||||||||
|
|
|
|
|
|
|
|
|
|
|
|
|
|||||||||||||
| 424,207 | 446,243 | 454,308 | 469,285 | 486,228 | 72.6 | |||||||||||||||||||
| Total Gross Capital Formation |
||||||||||||||||||||||||
| Private sectors |
||||||||||||||||||||||||
| Producers’ Durable Equipment |
102,164 | 110,252 | 114,399 | 119,191 | 125,303 | 18.7 | ||||||||||||||||||
| Residential Construction |
24,529 | 25,968 | 26,865 | 27,563 | 27,501 | 4.1 | ||||||||||||||||||
| Public sectors |
30,043 | 29,775 | 30,831 | 32,019 | 32,926 | 4.9 | ||||||||||||||||||
|
|
|
|
|
|
|
|
|
|
|
|
|
|||||||||||||
| 156,736 | 165,994 | 172,096 | 178,773 | 185,729 | 27.7 | |||||||||||||||||||
| Additions to Business Inventories |
||||||||||||||||||||||||
| Private sectors |
2,310 | 2,330 | (685 | ) | 197 | (778 | ) | (0.1 | ) | |||||||||||||||
| Public sectors |
(44 | ) | (53 | ) | (291 | ) | (76 | ) | (98 | ) | (0.0 | ) | ||||||||||||
|
|
|
|
|
|
|
|
|
|
|
|
|
|||||||||||||
| 2,266 | 2,276 | (976 | ) | 121 | (876 | ) | (0.1 | ) | ||||||||||||||||
| Net Exports of Goods and Services |
(6,655 | ) | (22,862 | ) | (5,862 | ) | (5,398 | ) | (1,712 | ) | (0.3 | ) | ||||||||||||
|
|
|
|
|
|
|
|
|
|
|
|
|
|||||||||||||
| Nominal Gross Domestic Expenditures |
¥ | 576,554 | ¥ | 591,651 | ¥ | 619,565 | ¥ | 642,781 | ¥ | 669,369 | 100.0 | % | ||||||||||||
|
|
|
|
|
|
|
|
|
|
|
|
|
|||||||||||||
| Real Gross Domestic Expenditures(b) |
¥ | 576,080 | ¥ | 584,362 | ¥ | 584,166 | ¥ | 587,135 | ¥ | 591,660 | ||||||||||||||
|
|
|
|
|
|
|
|
|
|
|
|||||||||||||||
| Surplus of the Nation on Current Account |
||||||||||||||||||||||||
| Exports of Goods and Services and Other Receipts from Abroad |
41,348 | 51,415 | 59,243 | 65,764 | 68,340 | |||||||||||||||||||
| Less: Imports of Goods and Services and Other Payments Abroad |
12,357 | 16,606 | 22,888 | 26,035 | 27,255 | |||||||||||||||||||
|
|
|
|
|
|
|
|
|
|
|
|||||||||||||||
| 28,991 | 34,809 | 36,355 | 39,728 | 41,085 | ||||||||||||||||||||
|
|
|
|
|
|
|
|
|
|
|
|||||||||||||||
| Gross National Income |
¥ | 605,545 | ¥ | 626,460 | ¥ | 655,920 | ¥ | 682,510 | ¥ | 710,454 | ||||||||||||||
| Percentage Changes of GDP from Previous Year |
||||||||||||||||||||||||
| At Nominal Prices |
4.0 | % | 2.6 | % | 4.7 | % | 3.7 | % | 4.1 | % | ||||||||||||||
| At Real Prices(b) |
3.9 | 1.4 | (0.0 | ) | 0.5 | 0.8 | ||||||||||||||||||
| Deflator(c) |
0.1 | 1.2 | 4.8 | 3.2 | 3.3 | |||||||||||||||||||
| (a) | GDP financial data are subject to change. |
| (b) | Real prices are based on calendar year 2020. |
| (c) | Deflator is a price index used to convert nominal prices into real prices. Deflator is derived by dividing nominal GDP by real GDP. |
Source: Economic and Social Research Institute, Cabinet Office
12
The following table sets forth information pertaining to Japan’s gross domestic product, as seasonally adjusted, for each of the eight quarters ended March 31, 2026.
| Quarterly Gross Domestic Product(a) | ||||||||||||||||||||||||||||||||
| 2024 | 2025 | 2026 | ||||||||||||||||||||||||||||||
| Second Quarter |
Third Quarter |
Fourth Quarter |
First Quarter |
Second Quarter |
Third Quarter |
Fourth Quarter |
First Quarter |
|||||||||||||||||||||||||
| (yen amounts in billions) | ||||||||||||||||||||||||||||||||
| (yen amounts in billions) | ||||||||||||||||||||||||||||||||
| Nominal Gross Domestic Expenditures(b) |
¥ | 632,073 | ¥ | 639,733 | ¥ | 646,711 | ¥ | 652,317 | ¥ | 664,561 | ¥ | 665,584 | ¥ | 671,469 | ¥ | 675,611 | ||||||||||||||||
|
|
|
|
|
|
|
|
|
|
|
|
|
|
|
|
|
|||||||||||||||||
| Real Gross Domestic Expenditures(b)(c) |
¥ | 582,338 | ¥ | 586,318 | ¥ | 588,359 | ¥ | 591,344 | ¥ | 592,943 | ¥ | 589,460 | ¥ | 590,546 | ¥ | 593,219 | ||||||||||||||||
|
|
|
|
|
|
|
|
|
|
|
|
|
|
|
|
|
|||||||||||||||||
| Percentage Changes of GDP from the Previous Quarter At Nominal Prices(d) |
1.9% | 1.2% | 1.1% | 0.9% | 1.9% | 0.2% | 0.9% | 0.6% | ||||||||||||||||||||||||
| At Real Prices(c)(d) |
(0.0) | 0.7 | 0.3 | 0.5 | 0.3 | (0.6) | 0.2 | 0.5 | ||||||||||||||||||||||||
| Deflator(e) |
2.0 | 0.5 | 0.7 | 0.4 | 1.6 | 0.7 | 0.7 | 0.2 | ||||||||||||||||||||||||
| (a) | Quarterly GDP financial data are subject to change. |
| (b) | Numbers are based on seasonally-adjusted GDP figures. |
| (c) | Real prices are based on calendar year 2020. |
| (d) | Percentage changes are based on seasonally-adjusted GDP figures. |
| (e) | Deflator is a price index used to convert nominal prices into real prices. Deflator is derived by dividing nominal GDP by real GDP. |
Source: Economic and Social Research Institute, Cabinet Office.
Per Capita Gross Domestic Product
The following table indicates per capita gross domestic product for the last five years.
| Per Capita GDP | ||||
| JFY |
Amount (in thousands of yen) |
Year-on-year change (%) | ||
| 2020 |
¥4,394 | (2.6) | ||
| 2021 |
4,594 | 4.5 | ||
| 2022 |
4,736 | 3.1 | ||
| 2023 |
4,981 | 5.2 | ||
| 2024 |
5,190 | 4.2 | ||
National Income
The following table sets forth national income for calendar year 2020 through calendar year 2024.
| National Income | ||||||||||||||||||||
| 2020 | 2021 | 2022 | 2023 | 2024 | ||||||||||||||||
| (yen amounts in billions) | ||||||||||||||||||||
| Domestic Factor Income |
¥ | 361,874 | ¥ | 374,374 | ¥ | 378,020 | ¥ | 404,184 | ¥ | 411,756 | ||||||||||
| Net Income from Abroad |
19,798 | 26,396 | 34,597 | 35,439 | 38,603 | |||||||||||||||
|
|
|
|
|
|
|
|
|
|
|
|||||||||||
| National Income at Factor Cost |
¥ | 381,672 | ¥ | 400,770 | ¥ | 412,617 | ¥ | 439,623 | ¥ | 450,360 | ||||||||||
|
|
|
|
|
|
|
|
|
|
|
|||||||||||
| Percentage Changes of Income at Factor Cost from Previous Year |
(5.8 | )% | 5.0 | % | 3.0 | % | 6.5 | % | 2.4 | % | ||||||||||
Source: Economic and Social Research Institute, Cabinet Office.
13
The following table sets forth the proportion of gross domestic product contributed by major industrial sectors of the economy for calendar year 2020 through calendar year 2024.
GDP by Industrial Sectors (at nominal prices)
| 2020 | 2021 | 2022 | 2023 | 2024 | ||||||||||||||||
| Industry |
||||||||||||||||||||
| Agriculture, forestry and fishing |
1.0% | 0.9% | 0.8% | 0.8% | 1.0% | |||||||||||||||
| Mining |
0.0 | 0.0 | 0.1 | 0.1 | 0.1 | |||||||||||||||
| Manufacturing |
19.8 | 19.7 | 18.8 | 19.5 | 18.8 | |||||||||||||||
| Electricity, gas and water supply and waste management service |
3.1 | 2.9 | 2.5 | 2.4 | 2.6 | |||||||||||||||
| Construction |
6.0 | 5.8 | 5.7 | 5.7 | 5.3 | |||||||||||||||
| Wholesale and retail trade |
12.3 | 12.7 | 12.3 | 11.8 | 12.4 | |||||||||||||||
| Transport and postal services |
4.6 | 4.3 | 4.7 | 5.1 | 5.2 | |||||||||||||||
| Accommodation and food service activities |
1.5 | 1.3 | 1.6 | 1.7 | 1.8 | |||||||||||||||
| Information and communications |
6.1 | 6.0 | 6.1 | 6.3 | 6.2 | |||||||||||||||
| Finance and insurance |
4.0 | 3.9 | 4.2 | 4.3 | 4.4 | |||||||||||||||
| Real estate |
12.7 | 12.8 | 12.8 | 12.7 | 12.7 | |||||||||||||||
| Professional, scientific and technical activities |
8.3 | 9.0 | 9.4 | 9.2 | 9.2 | |||||||||||||||
| Public administration |
5.0 | 4.9 | 4.9 | 4.8 | 4.8 | |||||||||||||||
| Education |
3.8 | 3.8 | 3.7 | 3.6 | 3.6 | |||||||||||||||
| Human health and social work activities |
7.3 | 7.1 | 6.9 | 6.8 | 6.8 | |||||||||||||||
| Other service activities |
4.1 | 4.2 | 4.4 | 4.5 | 4.4 | |||||||||||||||
|
|
|
|
|
|
|
|
|
|
|
|||||||||||
| Total |
99.8% | 99.5% | 99.0% | 99.3% | 99.2% | |||||||||||||||
Source: Economic and Social Research Institute, Cabinet Office, Annual Report on National Accounts.
The following table sets forth the total amounts of primary energy supplied and the percentages supplied by different sources for JFY 2020 through JFY 2024.
| Total Primary Energy Supplied (peta-joules) |
Sources of Primary Energy Supplied(a) | |||||||||||||||||||||
| JFY |
Oil | Coal | Nuclear | Natural Gas |
Other | |||||||||||||||||
| 2020 |
17,959 | 36.5 | % | 24.6 | % | 1.8 | % | 23.8 | % | 13.3 | % | |||||||||||
| 2021 |
18,716 | 36.1 | 25.7 | 3.2 | 21.4 | 13.6 | ||||||||||||||||
| 2022 |
18,299 | 36.2 | 25.7 | 2.6 | 21.5 | 14.0 | ||||||||||||||||
| 2023 |
17,558 | 35.6 | 24.4 | 4.1 | 20.7 | 15.2 | ||||||||||||||||
| 2024(b) |
17,461 | 34.5 | 24.6 | 4.5 | 21.0 | 15.3 | ||||||||||||||||
| (a) | Figures represent the proportion of each source as a share of the domestic primary energy supplied. Domestic primary energy supplied is total primary energy supplied less exports and inventory adjustments. |
| (b) | Standard heating value by energy source, which is used to create total primary energy supplied statistics, is revised every five years. Figures for 2024 represent the revised standard heating value by energy source. |
Source: Agency for Natural Resources and Energy, Ministry of Economy, Trade and Industry, Report on Energy Supply and Demand.
14
Since JFY 2011, largely due to the effects of the Earthquake, the import of oil and natural gas as alternatives to nuclear energy increased significantly as the demand increased for power generation at thermal power stations.
The table below sets forth information regarding crude oil imports for JFY 2021 through JFY 2025.
| JFY 2021 | JFY 2022 | JFY 2023 | JFY 2024 | JFY 2025 | ||||||||||||||||
| Volume of imports (thousand kilo-liters per day) |
406 | 435 | 396 | 369 | 383 | |||||||||||||||
| Cost of imports (c.i.f. in billions of yen) |
¥ | 8,078 | ¥ | 13,839 | ¥ | 11,294 | ¥ | 10,651 | ¥ | 9,454 | ||||||||||
| Average price (c.i.f. in yen kilo-liters) |
¥ | 54,575 | ¥ | 87,237 | ¥ | 77,877 | ¥ | 79,085 | ¥ | 67,608 | ||||||||||
Source: Trade Statistics of Japan, Ministry of Finance.
Japan has historically depended on oil for most of its energy requirements and almost all its oil is imported, mostly from the Middle East. Oil price movements thus have a major impact on the domestic economy. Although the oil price significantly declined soon after the outbreak of COVID-19 in 2020, below ¥20,000 per kilo-liter in May 2020, it has steadily increased since then, as the world economy has gradually recovered from the impact of COVID-19. Although the oil price has remained high since 2022 in part due to the conflict between Russia and Ukraine, the situation in the Middle East and the resulting disruption in the oil supply, recently the price has been highly volatile, marking ¥117,684 per kilo-liter in June 2026. In response to the situation in the Middle East, in the near term, the government has carried out emergency measures to curb dramatic fluctuations in oil prices.
The following table sets forth information relating to total electric power generating capacity and electric power generation for JFY 2020 through JFY 2024.
| JFY 2020 | JFY 2021 | JFY 2022 | JFY 2023 | JFY 2024 | ||||||||||||||||
| Electric power generating capacity(a): |
(megawatts) | |||||||||||||||||||
| Fossil Fuel |
191,758 | 188,256 | 187,879 | 179,497 | 182,141 | |||||||||||||||
| Hydro-electric |
50,033 | 50,009 | 50,008 | 50,066 | 50,072 | |||||||||||||||
| Nuclear |
33,083 | 33,083 | 33,083 | 33,083 | 33,083 | |||||||||||||||
| Other |
23,677 | 25,851 | 28,479 | 31,467 | 32,068 | |||||||||||||||
|
|
|
|
|
|
|
|
|
|
|
|||||||||||
| Total |
298,550 | 297,197 | 299,450 | 294,112 | 297,708 | |||||||||||||||
|
|
|
|
|
|
|
|
|
|
|
|||||||||||
| Electric power generation: |
(gigawatt-hours) | |||||||||||||||||||
| Fossil Fuel |
789,725 | 776,326 | 758,485 | 716,792 | 712,274 | |||||||||||||||
| Nuclear |
37,011 | 67,767 | 53,524 | 80,284 | 89,345 | |||||||||||||||
| Hydro-electric |
86,310 | 87,632 | 85,034 | 84,102 | 83,407 | |||||||||||||||
| Other |
35,637 | 38,525 | 41,969 | 44,801 | 49,468 | |||||||||||||||
|
|
|
|
|
|
|
|
|
|
|
|||||||||||
| Total |
948,979 | 970,249 | 939,025 | 926,130 | 934,504 | |||||||||||||||
|
|
|
|
|
|
|
|
|
|
|
|||||||||||
| (a) | At the end of fiscal year — March 31 |
Source: Handbook of Electric Power Industry, Agency for Natural Resources and Energy, Ministry of Economy, Trade and Industry.
On October 26, 2020, then-Prime Minister SUGA Yoshihide declared that Japan intends to achieve carbon neutrality by 2050. To this end, Japan aims to reduce greenhouse gas emissions to virtually zero by 2050 and realize a decarbonized society. On December 25, 2020, the government announced a “Green Growth Strategy Through Achieving Carbon Neutrality in 2050,” which sets high goals for 14 key fields across energy, transportation/manufacturing and home/office industries. This strategy makes explicit current challenges and future actions by priority field, and formulates action plans covering comprehensive policies in areas such as budgets, taxes, regulation reforms and standardization, and international collaboration. In addition, on June 9, 2021, the government decided on a regional decarbonization roadmap that outlines the process and concrete measures for transitioning to decarbonized society. Based on this roadmap, the Japanese government intends to propagate decarbonization throughout Japan by creating at least 100 decarbonization leading areas by FY2030 and implementing priority measures that will serve as the foundation for decarbonization throughout Japan, especially through an intensive five-year period of policy implementation. The administration of the former Prime Minister, KISHIDA Fumio, has succeeded the policy of the preceding Prime Minister, SUGA Yoshihide. The Japanese government announced the “Basic Policy on Economic and Fiscal Management and Reform 2022” on June 7, 2022, which intends to focus on investment in green transformation (GX). The “Basic Policy on Economic and Fiscal Management and Reform 2023” announced on June 16, 2023 continues to focus on accelerating GX investments.
15
The table below sets forth information concerning changes in Japan’s corporate goods and consumer price indices for the periods indicated.
| Calendar Year |
Corporate Goods Price Index(a) |
Consumer Price Index(b) |
||||||||||||||
| Index(c) | Annual % Change |
Index | Annual % Change |
|||||||||||||
| 2021 |
104.6 | 4.6 | 99.8 | (0.2) | ||||||||||||
| 2022 |
114.9 | 9.8 | 102.3 | 2.5 | ||||||||||||
| 2023 |
119.9 | 4.4 | 105.6 | 3.2 | ||||||||||||
| 2024 |
122.8 | 2.4 | 108.5 | 2.7 | ||||||||||||
| 2025 |
126.7 | 3.2 | 111.9 | 3.2 | ||||||||||||
| (a) | All commodities. Calendar year 2020=100. Source: Domestic Corporate Goods Price Index, Bank of Japan. |
| (b) | General index. Calendar year 2020=100. Source: Consumer Price Index, Statistics Bureau, Ministry of Internal Affairs and Communications. |
| (c) | Indices are calculated using the monthly averages. |
The number of employed persons increased from 2004 to 2007 and decreased from 2008 to 2012. After recovering in 2013, the number of employed persons increased from 2014 to 2019, followed by a decrease in 2020, the first in eight years. Then it recovered and increased for five consecutive years from 2021 to 2025. In 2024, the average employment was estimated at 67.8 million, of which 22.5% were employed in mining, manufacturing and construction, 2.8% were employed in agriculture, forestry and fisheries, and 74.7% were employed in services and other sectors. In 2025, the average employment was estimated at 68.3 million, of which 22.2% were employed in mining, manufacturing and construction, 2.7% were employed in agriculture, forestry and fisheries, and 75.1% were employed in services and other sectors. The unemployment rate (seasonally adjusted) in Japan gradually increased from 2008 to the middle of 2009, but has gradually decreased since the end of 2009. The unemployment rate increased in 2020 for the first time in eleven years, decreased in 2022 for the first time in four years, maintained the same rate in 2023, slightly decreased in 2024 and then maintained the same rate in 2025. It ranged between 2.4% and 2.6% during 2025. In 2026, the seasonally adjusted unemployment rate was 2.7% for January, 2.6% for February, 2.7% for March, 2.5% for April and 2.5% for May, the most recent five months for which statistics are available. Concerning short-term prospects, the improvement in the employment and income situation and the effects of the policies are expected to support a moderate recovery, while attention should be given to the effects caused from the situation in the Middle East. However, both the duration and extent of the impact on employment in Japan remain highly uncertain.
The following table indicates unemployment statistics for Japan for each of the last five years:
| Calendar Year |
Unemployment Rate (%) | |
| 2021 |
2.8 | |
| 2022 |
2.6 | |
| 2023 |
2.6 | |
| 2024 |
2.5 | |
| 2025 |
2.5 |
Source: Ministry of Internal Affairs and Communications “Labor Force Survey”.
16
The table below sets forth information regarding wage index (total cash earnings (nominal)) and industrial production index (manufacturing and mining) for the periods indicated.
| Wage Index(a) | Industrial Production Index(b) |
|||||||||||||
| Calendar Year |
Index(c) | Annual % Change |
Index | Annual % Change | ||||||||||
| 2021 |
100.3 | 0.3 | 105.4 | 5.4 | ||||||||||
| 2022 |
102.3 | 2.0 | 105.3 | (0.1 | ) | |||||||||
| 2023 |
103.5 | 1.2 | 103.9 | (1.3 | ) | |||||||||
| 2024 |
109.2 | 2.8 | 101.2 | (2.6 | ) | |||||||||
| 2025 |
111.7 | 2.3 | 100.9 | (0.3 | ) | |||||||||
| (a) | Calendar year 2020=100. Source: Monthly Labor Survey, Ministry of Health, Labor and Welfare. |
| (b) | Calendar year 2020=100. Source: Ministry of Economy, Trade and Industry. |
| (c) | Indices are calculated using the monthly averages. |
The following table shows selected employment information by industry.
| 2021 | 2022 | 2023 | 2024 | 2025 | ||||||||||||||||
| (all figures in percentages, except as indicated) | ||||||||||||||||||||
| Employed persons (in ten thousands of persons) |
6,713 | 6,723 | 6,747 | 6,781 | 6,828 | |||||||||||||||
| Employment by Industry: |
||||||||||||||||||||
| Agriculture, forestry and fisheries |
3.10 | % | 3.05 | % | 2.95 | % | 2.83 | % | 2.74 | % | ||||||||||
| Mining, manufacturing and construction |
22.84 | 22.68 | 22.82 | 22.49 | 22.16 | |||||||||||||||
| Services and other sectors |
74.07 | 74.27 | 74.23 | 74.68 | 75.10 | |||||||||||||||
|
|
|
|
|
|
|
|
|
|
|
|||||||||||
| Total |
100.0 | % | 100.0 | % | 100.0 | % | 100.0 | % | 100.0 | % | ||||||||||
|
|
|
|
|
|
|
|
|
|
|
|||||||||||
Source: Ministry of Internal Affairs and Communications “Labor Force Survey”.
17
The following table shows employment rate by age and gender.
| 2021 | 2022 | 2023 | 2024 | 2025 | ||||||||||||||||
| (all figures in percentages) | ||||||||||||||||||||
| Total |
60.4 | % | 60.9 | % | 61.2 | % | 61.7 | % | 62.2 | % | ||||||||||
| Employment rate by age: |
||||||||||||||||||||
| 15 – 64 years old |
77.7 | 78.4 | 78.9 | 79.4 | 80.0 | |||||||||||||||
| 15 – 24 years old |
46.6 | 46.6 | 47.8 | 48.8 | 49.6 | |||||||||||||||
| 25 – 34 years old |
86.0 | 86.6 | 86.8 | 87.6 | 88.7 | |||||||||||||||
| 35 – 44 years old |
85.4 | 86.2 | 86.6 | 87.0 | 87.6 | |||||||||||||||
| 45 – 54 years old |
86.0 | 86.6 | 86.8 | 87.2 | 87.8 | |||||||||||||||
| 55 – 64 years old |
77.0 | 78.1 | 78.7 | 79.2 | 79.7 | |||||||||||||||
| 55 – 59 years old |
82.1 | 82.8 | 83.1 | 83.4 | 83.9 | |||||||||||||||
| 60 – 64 years old |
71.5 | 73.0 | 74.0 | 74.3 | 74.9 | |||||||||||||||
| 65 and over |
25.1 | 25.2 | 25.2 | 25.7 | 26.0 | |||||||||||||||
| 65 – 69 years old |
50.3 | 50.8 | 52.0 | 53.6 | 54.5 | |||||||||||||||
| 70 – 74 years old |
32.6 | 33.5 | 34.0 | 35.1 | 36.2 | |||||||||||||||
| 75 and over |
10.5 | 11.0 | 11.4 | 12.0 | 12.6 | |||||||||||||||
| Employment rate by gender: |
||||||||||||||||||||
| Male |
69.1 | 69.4 | 69.5 | 69.6 | 69.8 | |||||||||||||||
| Female |
52.2 | 53.0 | 53.6 | 54.2 | 55.1 | |||||||||||||||
Source: Ministry of Internal Affairs and Communications “Labor Force Survey”.
The following table shows employment data by type of employment.
| 2021 | 2022 | 2023 | 2024 | 2025 | ||||||||||||||||
| (in ten thousands of persons) | ||||||||||||||||||||
| Employee (except for executive of company or corporation) |
5,672 | 5,699 | 5,739 | 5,780 | 5,837 | |||||||||||||||
| Regular employee |
3,596 | 3,597 | 3,615 | 3,654 | 3,708 | |||||||||||||||
| Non-regular employee |
2,075 | 2,101 | 2,124 | 2,126 | 2,128 | |||||||||||||||
Source: Ministry of Internal Affairs and Communications “Labor Force Survey”.
18
Aging Workforce and Population Decrease
One of the risks that the Japanese economy bears is the issue of the aging of the population accompanied with an overall population decrease. Population aging and decrease have placed downward pressure on economic growth. The negative impact can be reduced by enhancing productivity and competitiveness through the further opening of the Japanese economy to the world. These trends have an impact not only on the macro growth rate but also on consumption patterns (such as the older generations spending more than younger generations on service consumption) and, consequently, the country’s economic structure.
The impact of the aging and shrinking population on Japan’s fiscal structure is seen as a long-term risk. Social security benefit payments under the current system continues to increase. The ratio of pensions to national income are expected to remain at the same level, but that of welfare including medical benefits and nursing-care benefits have continuously increased and is expected to further grow. Population aging and decrease will thus modify the Japanese revenue structure. Furthermore, amid increasing capital mobility, it is imperative for Japan to foster an environment attractive to business enterprises. Under these circumstances, it has become more and more difficult to impose additional tax burdens on the income of individuals and corporations. The effects of the aging and shrinkage of the population would also be prominent in Japan’s regional economies.
The following table indicates the age distribution of Japan’s population:
Population and Percentage distribution by Age (5-Year Age Group)
| Both sex | ||||||||||||||||||||
| Age groups |
2021 | 2022 | 2023 | 2024 | 2025 | |||||||||||||||
| Population (in thousands of persons) | ||||||||||||||||||||
| Total |
125,502 | 124,947 | 124,352 | 123,802 | 123,165 | |||||||||||||||
| 0 – 4 years old |
4,389 | 4,247 | 4,087 | 3,934 | 3,770 | |||||||||||||||
| 5 – 9 |
5,038 | 4,948 | 4,838 | 4,710 | 4,522 | |||||||||||||||
| 10 – 14 |
5,357 | 5,308 | 5,248 | 5,185 | 5,116 | |||||||||||||||
| 15 – 19 |
5,580 | 5,512 | 5,494 | 5,457 | 5,470 | |||||||||||||||
| 20 – 24 |
6,263 | 6,263 | 6,236 | 6,260 | 6,223 | |||||||||||||||
| 25 – 29 |
6,379 | 6,412 | 6,479 | 6,519 | 6,596 | |||||||||||||||
| 30 – 34 |
6,556 | 6,446 | 6,380 | 6,395 | 6,442 | |||||||||||||||
| 35 – 39 |
7,354 | 7,212 | 7,047 | 6,871 | 6,701 | |||||||||||||||
| 40 – 44 |
8,173 | 7,946 | 7,765 | 7,631 | 7,475 | |||||||||||||||
| 45 – 49 |
9,732 | 9,462 | 9,115 | 8,745 | 8,406 | |||||||||||||||
| 50 – 54 |
9,252 | 9,435 | 9,650 | 9,788 | 9,787 | |||||||||||||||
| 55 – 59 |
7,824 | 8,075 | 8,279 | 8,490 | 8,621 | |||||||||||||||
| 60 – 64 |
7,391 | 7,445 | 7,507 | 7,571 | 7,825 | |||||||||||||||
| 65 – 69 |
7,869 | 7,535 | 7,332 | 7,268 | 7,168 | |||||||||||||||
| 70 – 74 |
9,672 | 9,337 | 8,817 | 8,198 | 7,696 | |||||||||||||||
| 75 – 79 |
6,712 | 7,030 | 7,474 | 7,886 | 8,456 | |||||||||||||||
| 80 – 84 |
5,563 | 5,743 | 5,895 | 6,138 | 5,927 | |||||||||||||||
| 85 – 89 |
3,872 | 3,955 | 3,979 | 3,944 | 4,014 | |||||||||||||||
| 90 – 94 |
1,904 | 1,989 | 2,045 | 2,088 | 2,175 | |||||||||||||||
| 95 – 99 |
537 | 561 | 597 | 635 | 684 | |||||||||||||||
| 100 and over |
85 | 87 | 87 | 87 | 90 | |||||||||||||||
| Regrouped |
||||||||||||||||||||
| 0 – 14 years old |
14,784 | 14,503 | 14,173 | 13,830 | 13,408 | |||||||||||||||
| 15 – 64 |
74,504 | 74,208 | 73,952 | 73,728 | 73,547 | |||||||||||||||
| 65 and over |
36,214 | 36,236 | 36,227 | 36,243 | 36,210 | |||||||||||||||
| 65 – 74 years old |
17,540 | 16,872 | 16,149 | 15,466 | 14,864 | |||||||||||||||
| 75 and over |
18,674 | 19,364 | 20,078 | 20,777 | 21,346 | |||||||||||||||
19
| Both sex | ||||||||||||||||||||
| Age groups |
2021 | 2022 | 2023 | 2024 | 2025 | |||||||||||||||
| Percentage Distribution (%) | ||||||||||||||||||||
| Total |
100.00 | 100.00 | 100.00 | 100.00 | 100.00 | |||||||||||||||
| 0 – 4 years old |
3.50 | 3.40 | 3.29 | 3.18 | 3.06 | |||||||||||||||
| 5 – 9 |
4.01 | 3.96 | 3.89 | 3.80 | 3.67 | |||||||||||||||
| 10 – 14 |
4.27 | 4.25 | 4.22 | 4.19 | 4.15 | |||||||||||||||
| 15 – 19 |
4.45 | 4.41 | 4.42 | 4.41 | 4.44 | |||||||||||||||
| 20 – 24 |
4.99 | 5.01 | 5.01 | 5.06 | 5.05 | |||||||||||||||
| 25 – 29 |
5.08 | 5.13 | 5.21 | 5.27 | 5.36 | |||||||||||||||
| 30 – 34 |
5.22 | 5.16 | 5.13 | 5.17 | 5.23 | |||||||||||||||
| 35 – 39 |
5.86 | 5.77 | 5.67 | 5.55 | 5.44 | |||||||||||||||
| 40 – 44 |
6.51 | 6.36 | 6.24 | 6.16 | 6.07 | |||||||||||||||
| 45 – 49 |
7.75 | 7.57 | 7.33 | 7.06 | 6.82 | |||||||||||||||
| 50 – 54 |
7.37 | 7.55 | 7.76 | 7.91 | 7.95 | |||||||||||||||
| 55 – 59 |
6.23 | 6.46 | 6.66 | 6.86 | 7.00 | |||||||||||||||
| 60 – 64 |
5.89 | 5.96 | 6.04 | 6.12 | 6.35 | |||||||||||||||
| 65 – 69 |
6.27 | 6.03 | 5.90 | 5.87 | 5.82 | |||||||||||||||
| 70 – 74 |
7.71 | 7.47 | 7.09 | 6.62 | 6.25 | |||||||||||||||
| 75 – 79 |
5.35 | 5.63 | 6.01 | 6.37 | 6.87 | |||||||||||||||
| 80 – 84 |
4.43 | 4.60 | 4.74 | 4.96 | 4.81 | |||||||||||||||
| 85 – 89 |
3.09 | 3.17 | 3.20 | 3.19 | 3.26 | |||||||||||||||
| 90 – 94 |
1.52 | 1.59 | 1.64 | 1.69 | 1.77 | |||||||||||||||
| 95 – 99 |
0.43 | 0.45 | 0.48 | 0.51 | 0.56 | |||||||||||||||
| 100 and over |
0.07 | 0.07 | 0.07 | 0.07 | 0.07 | |||||||||||||||
| Regrouped |
||||||||||||||||||||
| 0 – 14 years old |
11.78 | 11.61 | 11.40 | 11.17 | 10.89 | |||||||||||||||
| 15 – 64 |
59.36 | 59.39 | 59.47 | 59.55 | 59.71 | |||||||||||||||
| 65 and over |
28.86 | 29.00 | 29.13 | 29.27 | 29.40 | |||||||||||||||
| 65 – 74 years old |
13.98 | 13.50 | 12.99 | 12.49 | 12.07 | |||||||||||||||
| 75 and over |
14.88 | 15.50 | 16.15 | 16.78 | 17.33 | |||||||||||||||
If the population of Japan continues to decrease, it may have a material adverse impact on Japan’s overall socioeconomics in the future, including with respect to economic scale, standard of living and sustainability of the social security system.
20
FOREIGN TRADE AND BALANCE OF PAYMENTS
In 2024, Japan had a trade deficit of ¥5,628 billion due to an increase in imports including computers and their peripherals, and non-ferrous metal ores, which was partially offset by an increase in exports including semiconductor manufacturing equipment and automobiles. In 2025, Japan had a trade deficit of ¥2,930 billion due to an increase in exports including semiconductors and other electronic components, and food products, which offset an increase in imports of computer (including peripheral equipment) and telecommunication devices. However, potential international trade disruptions resulting from the conflict between Russia and Ukraine, the situation in the Middle East or changes in trade policy in other countries such as introduction of new tariffs on exports, imports and the overall trade balance is highly uncertain.
The following tables set forth information relating to foreign trade for the years indicated. In these tables exports are stated on a free on board (“f.o.b.”) basis and imports on a cost insurance and freight (“c.i.f.”) basis. Monetary figures are based on actual movements of goods as calculated by the Ministry of Finance. (This method of computation differs from that used in calculating balance of payments, in which both exports and imports are stated on an f.o.b. basis.)
Foreign Trade of Japan
| Value Index(a) | Quantum Index(a) | Unit Value Index(a) | Terms of Trade(b) |
|||||||||||||||||||||||||
| Exports | Imports | Exports | Imports | Exports | Imports | Index | ||||||||||||||||||||||
| 2021 |
121.5 | 124.8 | 110.7 | 104.8 | 109.7 | 119.1 | 92.1 | |||||||||||||||||||||
| 2022 |
143.5 | 174.2 | 110.0 | 104.4 | 130.4 | 166.9 | 78.1 | |||||||||||||||||||||
| 2023 |
147.5 | 162.3 | 105.7 | 99.3 | 139.5 | 163.4 | 85.4 | |||||||||||||||||||||
| 2024 |
156.6 | 165.7 | 102.9 | 96.8 | 152.1 | 171.2 | 88.8 | |||||||||||||||||||||
| 2025 |
161.4 | 166.6 | 102.7 | 100.3 | 157.2 | 166.1 | 94.6 | |||||||||||||||||||||
| (a) | Calendar year 2020=100. |
| (b) | Unit value index of exports divided by unit value index of imports, multiplied by 100. |
Source: Japan Tariff Association, Ministry of Finance.
21
Composition of Japan’s Exports and Imports
| 2021 | 2022 | 2023 | 2024 | 2025 | ||||||||||||||||||||||||||||||||||||
| (yen amounts in billions) | ||||||||||||||||||||||||||||||||||||||||
| JAPAN’S EXPORTS |
||||||||||||||||||||||||||||||||||||||||
| Textile Products |
¥ | 862 | 1.0 | % | ¥ | 1,003 | 1.0 | % | ¥ | 1,036 | 1.0 | % | ¥ | 1,190 | 1.1 | % | ¥ | 1,208 | 1.1 | % | ||||||||||||||||||||
| Metals and Metal Products |
7,140 | 8.6 | 8,556 | 8.7 | 8,275 | 8.2 | 8,508 | 7.9 | 8,191 | 7.4 | ||||||||||||||||||||||||||||||
| Machinery and Equipment: |
||||||||||||||||||||||||||||||||||||||||
| Ships |
1,050 | 1.3 | 1,157 | 1.2 | 1,350 | 1.3 | 1,449 | 1.4 | 1,573 | 1.4 | ||||||||||||||||||||||||||||||
| Motor Vehicles |
10,722 | 12.9 | 13,012 | 13.3 | 17,265 | 17.1 | 17,910 | 16.7 | 17,612 | 16.0 | ||||||||||||||||||||||||||||||
| TV and Radio Receivers |
96 | 0.1 | 72 | 0.1 | 81 | 0.1 | 79 | 0.1 | 64 | 0.1 | ||||||||||||||||||||||||||||||
| Motorcycles |
307 | 0.4 | 414 | 0.4 | 492 | 0.5 | 500 | 0.5 | 561 | 0.5 | ||||||||||||||||||||||||||||||
| Scientific and Optical Instruments |
2,322 | 2.8 | 2,511 | 2.6 | 2,497 | 2.5 | 2,717 | 2.5 | 2,682 | 2.4 | ||||||||||||||||||||||||||||||
| Other(a) |
35,803 | 43.1 | 40,751 | 41.5 | 39,740 | 39.4 | 41,800 | 39.0 | 42,681 | 38.7 | ||||||||||||||||||||||||||||||
|
|
|
|
|
|
|
|
|
|
|
|
|
|
|
|
|
|
|
|
|
|||||||||||||||||||||
| Total Machinery and Equipment |
50,300 | 60.5 | 57,917 | 59.0 | 61,424 | 60.9 | 64,454 | 60.2 | 65,174 | 59.0 | ||||||||||||||||||||||||||||||
| Chemicals |
10,552 | 12.7 | 11,794 | 12.0 | 11,024 | 10.9 | 11,845 | 11.1 | 11,852 | 10.7 | ||||||||||||||||||||||||||||||
| Foods and Beverages |
992 | 1.2 | 1,137 | 1.2 | 1,127 | 1.1 | 1,178 | 1.1 | 1,369 | 1.2 | ||||||||||||||||||||||||||||||
| Other Exports(b) |
13,244 | 15.9 | 17,767 | 18.1 | 17,986 | 17.8 | 19,912 | 18.6 | 22,607 | 20.5 | ||||||||||||||||||||||||||||||
|
|
|
|
|
|
|
|
|
|
|
|
|
|
|
|
|
|
|
|
|
|||||||||||||||||||||
| Grand Total |
¥ | 83,091 | 100.0 | % | ¥ | 98,174 | 100.0 | % | ¥ | 100,873 | 100.0 | % | ¥ | 107,088 | 100.0 | % | ¥ | 110,400 | 100.0 | % | ||||||||||||||||||||
|
|
|
|
|
|
|
|
|
|
|
|
|
|
|
|
|
|
|
|
|
|||||||||||||||||||||
| JAPAN’S IMPORTS |
||||||||||||||||||||||||||||||||||||||||
| Foods and Beverages |
¥ | 7,383 | 8.7 | % | ¥ | 9,494 | 8.0 | % | ¥ | 9,342 | 8.5 | % | ¥ | 9,857 | 8.7 | % | ¥ | 10,225 | 9.0 | % | ||||||||||||||||||||
| Raw Materials |
6,936 | 8.2 | 8,150 | 6.9 | 7,188 | 6.5 | 7,987 | 7.1 | 7,642 | 6.7 | ||||||||||||||||||||||||||||||
| Chemicals |
9,769 | 11.5 | 13,331 | 11.2 | 11,624 | 10.5 | 11,816 | 10.5 | 12,162 | 10.7 | ||||||||||||||||||||||||||||||
| Mineral Fuels: |
||||||||||||||||||||||||||||||||||||||||
| Petroleum |
6,929 | 8.2 | 13,453 | 11.4 | 11,364 | 10.3 | 10,871 | 9.6 | 9,622 | 8.5 | ||||||||||||||||||||||||||||||
| Coal |
2,801 | 3.3 | 7,820 | 6.6 | 5,872 | 5.3 | 4,533 | 4.0 | 3,344 | 3.0 | ||||||||||||||||||||||||||||||
| Other(c) |
7,277 | 8.6 | 12,426 | 10.5 | 10,109 | 9.2 | 10,102 | 9.0 | 9,179 | 8.1 | ||||||||||||||||||||||||||||||
|
|
|
|
|
|
|
|
|
|
|
|
|
|
|
|
|
|
|
|
|
|||||||||||||||||||||
| Total Mineral Fuel |
17,007 | 20.0 | 33,699 | 28.4 | 27,346 | 24.8 | 25,506 | 22.6 | 22,145 | 19.5 | ||||||||||||||||||||||||||||||
| Machinery and Equipment |
26,766 | 31.5 | 32,554 | 27.5 | 34,426 | 31.2 | 35,990 | 31.9 | 38,833 | 34.3 | ||||||||||||||||||||||||||||||
| Other Imports(d) |
17,014 | 20.0 | 21,275 | 18.0 | 20,470 | 18.5 | 21,559 | 19.1 | 22,324 | 19.7 | ||||||||||||||||||||||||||||||
|
|
|
|
|
|
|
|
|
|
|
|
|
|
|
|
|
|
|
|
|
|||||||||||||||||||||
| Grand Total |
¥ | 84,875 | 100.0 | % | ¥ | 118,503 | 100.0 | % | ¥ | 110,395 | 100.0 | % | ¥ | 112,716 | 100.0 | % | ¥ | 113,330 | 100.0 | % | ||||||||||||||||||||
|
|
|
|
|
|
|
|
|
|
|
|
|
|
|
|
|
|
|
|
|
|||||||||||||||||||||
| (a) | This category includes general machinery, electronic components including semiconductors and electronic equipment including electronic circuit. |
| (b) | This category includes raw materials, mineral fuels and vehicle parts. |
| (c) | This category includes liquid natural gas and petroleum products. |
| (d) | This category includes clothing and accessories thereof, non-ferrous metal and scientific and optical instruments. |
Source: The Summary Report on Trade of Japan, Japan Tariff Association, Ministry of Finance.
22
Geographic Distribution of Japan’s Exports and Imports
| 2021 | 2022 | 2023 | 2024 | 2025 | ||||||||||||||||||||||||||||||||||||
| (yen amounts in billions) | ||||||||||||||||||||||||||||||||||||||||
| JAPAN’S EXPORTS |
||||||||||||||||||||||||||||||||||||||||
| Asia |
¥ | 48,158 | 58.0 | % | ¥ | 55,406 | 56.4 | % | ¥ | 52,497 | 52.0 | % | ¥ | 56,869 | 53.1 | % | ¥ | 59,900 | 54.3 | % | ||||||||||||||||||||
| China |
17,984 | 21.6 | 19,004 | 19.4 | 17,764 | 17.6 | 18,862 | 17.6 | 18,778 | 17.0 | ||||||||||||||||||||||||||||||
| (Asia NIES) |
17,849 | 21.5 | 21,256 | 21.7 | 19,808 | 19.6 | 22,338 | 20.9 | 24,464 | 22.2 | ||||||||||||||||||||||||||||||
| (ASEAN) |
12,461 | 15.0 | 15,544 | 15.8 | 14,717 | 14.6 | 15,354 | 14.3 | 15,957 | 14.5 | ||||||||||||||||||||||||||||||
| Oceania |
2,194 | 2.6 | 2,816 | 2.9 | 3,019 | 3.0 | 3,054 | 2.9 | 2,855 | 2.6 | ||||||||||||||||||||||||||||||
| Australia |
1,675 | 2.0 | 2,173 | 2.2 | 2,356 | 2.3 | 2,419 | 2.3 | 2,237 | 2.0 | ||||||||||||||||||||||||||||||
| North America |
15,748 | 19.0 | 19,387 | 19.7 | 21,797 | 21.6 | 22,984 | 21.5 | 22,019 | 19.9 | ||||||||||||||||||||||||||||||
| U.S.A. |
14,832 | 17.8 | 18,255 | 18.6 | 20,260 | 20.1 | 21,295 | 19.9 | 20,374 | 18.5 | ||||||||||||||||||||||||||||||
| Canada |
917 | 1.1 | 1,132 | 1.2 | 1,537 | 1.5 | 1,689 | 1.6 | 1,645 | 1.5 | ||||||||||||||||||||||||||||||
| Central and South America |
3,086 | 3.7 | 3,737 | 3.8 | 4,352 | 4.3 | 4,678 | 4.4 | 4,926 | 4.5 | ||||||||||||||||||||||||||||||
| Western Europe |
8,851 | 10.7 | 10,741 | 10.9 | 12,232 | 12.1 | 11,936 | 11.1 | 12,517 | 11.3 | ||||||||||||||||||||||||||||||
| EU(a) |
7,668 | 9.2 | 9,358 | 9.5 | 10,374 | 10.3 | 9,967 | 9.3 | 10,093 | 9.1 | ||||||||||||||||||||||||||||||
| Central and Eastern Europe, Russia etc. |
1,946 | 2.3 | 2,034 | 2.1 | 2,026 | 2.0 | 2,054 | 1.9 | 2,023 | 1.8 | ||||||||||||||||||||||||||||||
| Russia |
862 | 1.0 | 604 | 0.6 | 396 | 0.4 | 328 | 0.3 | 366 | 0.3 | ||||||||||||||||||||||||||||||
| Middle East |
2,052 | 2.5 | 2,782 | 2.8 | 3,552 | 3.5 | 4,192 | 3.9 | 4,636 | 4.2 | ||||||||||||||||||||||||||||||
| Africa |
1,055 | 1.3 | 1,272 | 1.3 | 1,399 | 1.4 | 1,320 | 1.2 | 1,524 | 1.4 | ||||||||||||||||||||||||||||||
|
|
|
|
|
|
|
|
|
|
|
|
|
|
|
|
|
|
|
|
|
|||||||||||||||||||||
| Total |
¥ | 83,091 | 100.0 | % | ¥ | 98,174 | 100.0 | % | ¥ | 100,873 | 100.0 | % | ¥ | 107,088 | 100.0 | % | ¥ | 110,400 | 100.0 | % | ||||||||||||||||||||
|
|
|
|
|
|
|
|
|
|
|
|
|
|
|
|
|
|
|
|
|
|||||||||||||||||||||
| JAPAN’S IMPORTS |
||||||||||||||||||||||||||||||||||||||||
| Asia |
¥ | 41,094 | 48.4 | % | ¥ | 53,401 | 45.1 | % | ¥ | 52,005 | 47.1 | % | ¥ | 53,910 | 47.8 | % | ¥ | 55,754 | 49.2 | % | ||||||||||||||||||||
| China |
20,382 | 24.0 | 24,850 | 21.0 | 24,424 | 22.1 | 25,313 | 22.5 | 26,700 | 23.6 | ||||||||||||||||||||||||||||||
| (Asia NIES) |
8,293 | 9.8 | 10,956 | 9.2 | 10,784 | 9.8 | 10,818 | 9.6 | 10,911 | 9.6 | ||||||||||||||||||||||||||||||
| (ASEAN) |
12,483 | 14.7 | 17,715 | 14.9 | 16,914 | 15.3 | 17,647 | 15.7 | 17,892 | 15.8 | ||||||||||||||||||||||||||||||
| Oceania |
6,434 | 7.6 | 12,693 | 10.7 | 9,979 | 9.0 | 8,921 | 7.9 | 7,745 | 6.8 | ||||||||||||||||||||||||||||||
| Australia |
5,753 | 6.8 | 11,622 | 9.8 | 9,097 | 8.2 | 8,016 | 7.1 | 6,802 | 6.0 | ||||||||||||||||||||||||||||||
| North America |
10,430 | 12.3 | 13,945 | 11.8 | 13,605 | 12.3 | 14,676 | 13.0 | 14,755 | 13.0 | ||||||||||||||||||||||||||||||
| U.S.A. |
8,916 | 10.5 | 11,759 | 9.9 | 11,555 | 10.5 | 12,685 | 11.3 | 12,910 | 11.4 | ||||||||||||||||||||||||||||||
| Canada |
1,507 | 1.8 | 2,175 | 1.8 | 2,038 | 1.8 | 1,979 | 1.8 | 1,833 | 1.6 | ||||||||||||||||||||||||||||||
| Central and South America |
3,679 | 4.3 | 4,854 | 4.1 | 4,732 | 4.3 | 5,021 | 4.5 | 5,206 | 4.6 | ||||||||||||||||||||||||||||||
| Western Europe |
10,860 | 12.8 | 13,037 | 11.0 | 13,170 | 11.9 | 13,860 | 12.3 | 14,835 | 13.1 | ||||||||||||||||||||||||||||||
| EU(a) |
9,453 | 11.1 | 11,446 | 9.7 | 11,428 | 10.4 | 11,963 | 10.6 | 12,759 | 11.3 | ||||||||||||||||||||||||||||||
| Central and Eastern Europe, Russia etc. |
2,375 | 2.8 | 2,985 | 2.5 | 2,057 | 1.9 | 1,979 | 1.8 | 1,977 | 1.7 | ||||||||||||||||||||||||||||||
| Russia |
1,552 | 1.8 | 1,972 | 1.7 | 1,033 | 0.9 | 860 | 0.8 | 828 | 0.7 | ||||||||||||||||||||||||||||||
| Middle East |
8,471 | 10.0 | 15,608 | 13.2 | 13,328 | 12.1 | 12,975 | 11.5 | 11,540 | 10.2 | ||||||||||||||||||||||||||||||
| Africa |
1,531 | 1.8 | 1,981 | 1.7 | 1,518 | 1.4 | 1,375 | 1.2 | 1,517 | 1.3 | ||||||||||||||||||||||||||||||
|
|
|
|
|
|
|
|
|
|
|
|
|
|
|
|
|
|
|
|
|
|||||||||||||||||||||
| Grand Total |
¥ | 84,875 | 100.0 | % | ¥ | 118,503 | 100.0 | % | ¥ | 110,395 | 100.0 | % | ¥ | 112,716 | 100.0 | % | ¥ | 113,330 | 100.0 | % | ||||||||||||||||||||
|
|
|
|
|
|
|
|
|
|
|
|
|
|
|
|
|
|
|
|
|
|||||||||||||||||||||
Source: Trade Statistics of Japan, Ministry of Finance.
| (a) | Data after February 2020 does not include the United Kingdom, as the United Kingdom exited the European Union (EU) on January 31, 2020. |
23
In 2025, Current Account surplus increased to ¥32,235 billion, mainly due to the narrowing of the trade deficit and Primary Income influenced by earnings on foreign direct investment throughout the year.
Balance of Payments of Japan
| 2021 | 2022 | 2023 | 2024 | 2025 | ||||||||||||||||
| (in billions of yen) | ||||||||||||||||||||
| Current Account |
¥ | 21,467 | ¥ | 11,443 | ¥ | 22,475 | ¥ | 29,277 | ¥ | 32,235 | ||||||||||
| Balance on Goods and Services |
(2,483) | (21,066) | (9,952) | (5,909) | (4,011) | |||||||||||||||
| Trade Balance |
1,762 | (15,511) | (6,612) | (2,714) | (568) | |||||||||||||||
| Exports (f.o.b.) |
82,353 | 98,858 | 100,491 | 106,623 | 108,547 | |||||||||||||||
| Imports (f.o.b.) |
80,590 | 114,369 | 107,103 | 109,337 | 109,114 | |||||||||||||||
| Services |
(4,246) | (5,556) | (3,341) | (3,194) | (3,443) | |||||||||||||||
| Primary Income(a) |
26,309 | 35,042 | 36,566 | 40,328 | 41,820 | |||||||||||||||
| Secondary Income(b) |
(2,359) | (2,533) | (4,139) | (5,142) | (5,574) | |||||||||||||||
| Capital Account |
(423) | (114) | (391) | (221) | (432) | |||||||||||||||
| Financial Account(c) |
16,768 | 6,419 | 24,532 | 24,965 | 29,684 | |||||||||||||||
| Assets |
(13,295) | (43,996) | (47,960) | (86,414) | (53,961) | |||||||||||||||
| Liabilities |
(30,063) | (50,415) | (72,492) | (111,378) | (83,645) | |||||||||||||||
| Net Errors and Omissions |
(4,275) | (4,909) | 2,447 | (4,092) | (2,119) | |||||||||||||||
| (a) | Primary Income mainly shows balance of payments of interests and dividends from external financial credits and debts and includes such items as receipt and payment of dividends and interests between parent companies and their subsidiaries, receipt and payment of stock dividends and bond interests, and receipt and payment of interests related to loans, borrowings, and deposits. |
| (b) | Secondary Income shows balance of payments of provision of assets unaccompanied by consideration between residents and non-residents and includes such items as receipt and payment of financial support, donations, and gifts by the government or by the people. |
| (c) | Positive figures (+) show increases in net assets, negative figures (-) show decreases in net assets in “Financial Account”. |
Source: Balance of Payments, Ministry of Finance.
Official Reserves Assets
| As of December 31, |
Gold(a) | Foreign Currency Reserves |
IMF Reserve Position |
SDRs (Special Drawing Rights) |
Other Reserve Assets |
Total | ||||||||||||||||||
| (in millions of dollars) | ||||||||||||||||||||||||
| 2021 |
$ | 49,505 | $ | 1,278,925 | $ | 10,643 | $ | 62,330 | $ | 4,347 | $ | 1,405,750 | ||||||||||||
| 2022 |
49,295 | 1,103,907 | 10,817 | 59,275 | 4,282 | 1,227,576 | ||||||||||||||||||
| 2023 |
56,095 | 1,159,849 | 10,597 | 57,508 | 10,588 | 1,294,637 | ||||||||||||||||||
| 2024 |
71,013 | 1,077,137 | 10,199 | 57,197 | 15,169 | 1,230,715 | ||||||||||||||||||
| 2025 |
117,172 | 1,164,196 | 11,262 | 60,840 | 16,305 | 1,369,775 | ||||||||||||||||||
| (a) | The valuation of gold reflects marked-to-market values. |
Source: International Reserves/Foreign Currency Liquidity, Ministry of Finance.
24
The following table sets forth the high, low and average daily interbank rate for the U.S. dollar against the yen in the Tokyo foreign exchange market for the years indicated.
| 2021 | 2022 | 2023 | 2024 | 2025 | ||||||||||||||||
| Average (Central Rate) |
¥ | 109.89 | ¥ | 131.57 | ¥ | 140.59 | ¥ | 151.59 | ¥ | 149.56 | ||||||||||
| High |
115.45 | 150.48 | 151.80 | 161.94 | 158.45 | |||||||||||||||
| Low |
102.60 | 113.63 | 127.22 | 140.34 | 139.89 | |||||||||||||||
Source: Status of Transactions on Tokyo Foreign Exchange Market, Bank of Japan.
In recent months, the exchange rate for the U.S. dollar against the yen has sharply increased. As of July 31, 2026, the spot buying rate quoted on the Tokyo foreign exchange market as reported by the BOJ at 5:00 p.m., Tokyo time, was ¥160.21 = $1.00, and the noon buying rate on July 24, 2026 for cable transfers in New York City payable in yen, as reported by the Federal Reserve Bank of New York, was ¥163.71 = $1.00.
Foreign exchange intervention is conducted to stabilize the foreign exchange market. In Japan, foreign exchange intervention is to be carried out under the authority of the Minister of Finance. The BOJ conducts foreign exchange interventions on behalf of and at the instruction of the minister. When the minister deems it necessary to intervene in the foreign exchange market, the Ministry of Finance gives the BOJ specific instructions for foreign exchange intervention. With respect to funding, as foreign exchange intervention involves buying and selling currencies, it requires funds such as Japanese yen and U.S. dollars. In Japan, the Foreign Exchange Fund Special Account (FEFSA), which falls under the jurisdiction of the Ministry of Finance, is used for foreign exchange intervention.
The total amount of foreign exchange intervention operations by the Ministry of Finance for the period from August 30, 2022 through October 27, 2022 was ¥9,188.1 billion. Following such operations, Japan’s reserve assets totaled $1,194,568 million as of October 31, 2022, down $97,504 million from the end of August. The total amount of foreign exchange intervention operations by the Ministry of Finance for the period from April 26, 2024 through May 29, 2024 was ¥9,788.5 billion. Following such operations, Japan’s reserve assets totaled $1,231,572 million as of May 31, 2024, down $47,405 million from the end of April. The total amount of foreign exchange intervention operations by the Ministry of Finance for the period from June 27, 2024 through July 29, 2024 was ¥5,534.8 billion. Following such operations, Japan’s reserve assets totaled $1,219,077 million as of July 31, 2024, down $12,418 million from the end of June. The total amount of foreign exchange intervention operations by the Ministry of Finance for the period from April 28, 2026 through May 27, 2026 was ¥11,734.9 billion. Following such operations, Japan’s reserve assets totaled $1,305,874 million as of May 31, 2026, down $77,120 million from the end of April. As of June 30, 2026, Japan’s reserve assets totaled $1,287,476 million.
The following table sets forth information regarding annual foreign direct investment in Japan and annual foreign direct investment abroad for the periods indicated.
Foreign direct investment in Japan (by industry)(a)
| 2021 | 2022 | 2023 | 2024 | 2025 | ||||||||||||||||
| (in billions of yen) | ||||||||||||||||||||
| Manufacturing (total)(b) |
¥ | 1,804.8 | ¥ | 1,620.4 | ¥ | 1,346.6 | ¥ | 830.0 | ¥ | 916.1 | ||||||||||
| Food |
28.3 | (33.7 | ) | (77.7 | ) | 115.6 | (57.9 | ) | ||||||||||||
| Textile |
6.5 | 11.2 | 8.9 | 15.2 | (13.4 | ) | ||||||||||||||
| Lumber and pulp |
8.6 | 2.6 | 3.7 | 4.7 | 7.7 | |||||||||||||||
| Chemicals and pharmaceuticals |
1,586.9 | 447.5 | 468.8 | 276.3 | 619.3 | |||||||||||||||
| Petroleum |
5.2 | (18.4 | ) | (16.6 | ) | 3.5 | 8.5 | |||||||||||||
| Rubber and leather |
(0.8 | ) | 1.0 | 9.9 | 3.9 | (19.5 | ) | |||||||||||||
| Glass and ceramics |
(3.8 | ) | 14.4 | 16.4 | 0.4 | 2.6 | ||||||||||||||
| Iron, non-ferrous, and metals |
7.9 | 371.3 | (0.3 | ) | (3.3 | ) | 102.3 | |||||||||||||
| General machinery |
(8.0 | ) | 91.6 | 51.5 | 46.9 | 31.8 | ||||||||||||||
| Electric machinery |
287.5 | 394.9 | 514.2 | 438.7 | 111.3 | |||||||||||||||
| Transportation equipment |
(109.5 | ) | 321.6 | 133.6 | 101.9 | 122.6 | ||||||||||||||
| Precision machinery |
(5.3 | ) | 4.3 | 238.1 | (175.8 | ) | (31.5 | ) | ||||||||||||
25
| 2021 | 2022 | 2023 | 2024 | 2025 | ||||||||||||||||
| (in billions of yen) | ||||||||||||||||||||
| Non-manufacturing (total)(c) |
1,959.1 | 2,896.8 | 1,556.2 | 1,335.0 | 1,227.1 | |||||||||||||||
| Farming and forestry |
0.4 | 0.5 | 0.5 | 2.3 | 2.4 | |||||||||||||||
| Fishery and marine products |
1.1 | 3.7 | 2.6 | (48.7 | ) | 0.9 | ||||||||||||||
| Mining |
5.4 | 2.3 | (9.6 | ) | 1.6 | 2.3 | ||||||||||||||
| Construction |
15.5 | (12.3 | ) | (14.9 | ) | 11.3 | (25.8 | ) | ||||||||||||
| Transportation |
219.7 | 700.6 | 63.8 | 127.0 | (9.0 | ) | ||||||||||||||
| Communications |
369.7 | 508.0 | (47.1 | ) | 451.3 | 498.4 | ||||||||||||||
| Wholesale and retail |
(11.9 | ) | 125.4 | 512.4 | (486.8 | ) | (881.4 | ) | ||||||||||||
| Finance and insurance |
1,177.5 | 1,156.4 | 985.7 | 527.6 | 1,148.0 | |||||||||||||||
| Real estate |
(69.8 | ) | (5.6 | ) | 67.5 | 196.2 | 36.8 | |||||||||||||
| Services |
76.9 | 230.8 | (8.6 | ) | 350.8 | (32.7 | ) | |||||||||||||
|
|
|
|
|
|
|
|
|
|
|
|||||||||||
| Total |
¥ | 3,763.9 | ¥ | 4,517.2 | ¥ | 2,902.8 | ¥ | 2,165.1 | ¥ | 2,143.2 | ||||||||||
|
|
|
|
|
|
|
|
|
|
|
|||||||||||
| (a) | Starting with transactions recognized in January 2014, the BOJ began using the Sixth Edition of “Balance of Payments and International Investment Position Manual” (BPM6) released by International Monetary Fund in 2008 to calculate the data provided in this table. |
| (b) | The total amounts for Manufacturing include other types of manufacturing not separately listed in the table and therefore are different from the sum of listed subcategories of manufacturing. |
| (c) | The total amounts for Non-manufacturing include other industries not separately listed in the table and therefore are different from the sum of listed subcategories of Non-manufacturing industries. |
Source: Outward / Inward Direct Investment, breakdown by Region and Industry, Ministry of Finance.
26
Foreign direct investment in Japan (by region)(a)
| 2021 | 2022 | 2023 | 2024 | 2025 | ||||||||||||||||
| (in billions of yen) | ||||||||||||||||||||
| North America |
¥ | 922.7 | ¥ | 1,809.2 | ¥ | 945.9 | ¥ | 156.7 | ¥ | 305.7 | ||||||||||
| Asia |
2,095.4 | 1,345.9 | 1,134.7 | 1,202.0 | 1,758.3 | |||||||||||||||
| Europe |
214.4 | 789.1 | 671.6 | 787.3 | 109.2 | |||||||||||||||
| Other regions |
531.4 | 573.0 | 150.5 | 19.0 | (30.0 | ) | ||||||||||||||
|
|
|
|
|
|
|
|
|
|
|
|||||||||||
| Total |
¥ | 3,763.9 | ¥ | 4,517.2 | ¥ | 2,902.8 | ¥ | 2,165.1 | ¥ | 2,143.2 | ||||||||||
|
|
|
|
|
|
|
|
|
|
|
|||||||||||
| (a) | Starting with transactions recognized in January 2014, the BOJ began using the Sixth Edition of “Balance of Payments and International Investment Position Manual” (BPM6) released by International Monetary Fund in 2008 to calculate the data provided in this table. |
Source: Outward / Inward Direct Investment, breakdown by Region and Industry, Ministry of Finance.
Foreign direct investment abroad (by industry)(a)
| 2021 | 2022 | 2023 | 2024 | 2025 | ||||||||||||||||
| (in billions of yen) | ||||||||||||||||||||
| Manufacturing (total)(b) |
¥ | 5,677.3 | ¥ | 7,171.4 | ¥ | 9,208.5 | ¥ | 9,155.8 | ¥ | 11,934.0 | ||||||||||
| Food |
585.4 | 639.4 | 1,408.1 | 973.5 | 1,766.8 | |||||||||||||||
| Textile |
38.2 | 27.7 | 122.8 | 128.0 | 7.2 | |||||||||||||||
| Lumber and pulp |
105.1 | 195.0 | 79.7 | 88.0 | 1.1 | |||||||||||||||
| Chemicals and pharmaceuticals |
1,674.8 | 1,368.5 | 2,416.6 | 1,923.3 | 2,099.6 | |||||||||||||||
| Petroleum |
52.1 | 37.1 | 31.0 | 48.3 | 48.1 | |||||||||||||||
| Rubber and leather |
68.5 | 313.7 | 539.9 | 106.4 | 221.4 | |||||||||||||||
| Glass and ceramics |
107.3 | 172.2 | 143.1 | 187.5 | 197.1 | |||||||||||||||
| Iron, non-ferrous, and metals |
470.1 | 490.4 | 542.9 | 618.0 | 2,616.5 | |||||||||||||||
| General machinery |
770.6 | 1,133.9 | 1,007.5 | 997.6 | 724.1 | |||||||||||||||
| Electric machinery |
873.5 | 738.7 | 1,072.6 | 1,697.6 | 878.9 | |||||||||||||||
| Transportation equipment |
598.9 | 1,425.5 | 1,340.1 | 1,801.9 | 2,694.4 | |||||||||||||||
| Precision machinery |
135.7 | 367.5 | 230.5 | 138.8 | 49.6 | |||||||||||||||
| Non-manufacturing (total)(c) |
17,259.8 | 14,162.6 | 18,658.2 | 21,546.5 | 15,915.8 | |||||||||||||||
| Farming and forestry |
16.8 | 62.5 | 47.0 | 33.2 | 63.5 | |||||||||||||||
| Fishery and marine products |
(0.3 | ) | 5.6 | (3.3 | ) | 62.0 | 74.2 | |||||||||||||
| Mining |
1,114.5 | 1,751.7 | 2,176.3 | 1,145.0 | 1,571.5 | |||||||||||||||
| Construction |
89.6 | 179.5 | 259.5 | 322.6 | 239.9 | |||||||||||||||
| Transportation |
213.8 | 500.7 | 570.6 | 263.0 | 1,105.8 | |||||||||||||||
| Communications |
1,981.5 | 644.6 | 1,197.2 | 2,758.7 | 916.8 | |||||||||||||||
| Wholesale and retail |
5,756.0 | 4,268.1 | 4,684.5 | 4,297.5 | 2,144.1 | |||||||||||||||
| Finance and insurance |
6,327.9 | 4,329.8 | 5,665.4 | 9,158.8 | 6,895.7 | |||||||||||||||
| Real estate |
527.3 | 547.9 | 1,282.4 | 1,761.2 | 1,295.6 | |||||||||||||||
| Services |
446.0 | 1,166.5 | 1,506.5 | 753.2 | 676.1 | |||||||||||||||
|
|
|
|
|
|
|
|
|
|
|
|||||||||||
| Total |
¥ | 22,937.1 | ¥ | 21,334.0 | ¥ | 27,866.7 | ¥ | 30,702.3 | ¥ | 27,849.8 | ||||||||||
|
|
|
|
|
|
|
|
|
|
|
|||||||||||
| (a) | Starting with transactions recognized in January 2014, the BOJ began using the Sixth Edition of “Balance of Payments and International Investment Position Manual” (BPM6) released by International Monetary Fund in 2008 to calculate the data provided in this table. |
| (b) | The total amounts for Manufacturing include other types of manufacturing not separately listed in the table and therefore are different from the sum of listed subcategories of manufacturing. |
| (c) | The total amounts for Non-manufacturing include other industries not separately listed in the table and therefore are different from the sum of listed subcategories of Non-manufacturing industries. |
Source: Outward / Inward Direct Investment, breakdown by Region and Industry, Ministry of Finance.
27
Foreign direct investment abroad (by region)(a)
| 2021 | 2022 | 2023 | 2024 | 2025 | ||||||||||||||||
| (in billions of yen) | ||||||||||||||||||||
| North America |
¥ | 9,033.3 | ¥ | 8,953.7 | ¥ | 10,469.5 | ¥ | 13,672.9 | ¥ | 8,312.4 | ||||||||||
| Asia |
6,602.3 | 4,476.4 | 4,743.0 | 5,680.4 | 5,594.4 | |||||||||||||||
| Europe |
5,524.7 | 4,330.8 | 7,874.7 | 7,109.5 | 9,601.2 | |||||||||||||||
| Other regions |
1,776.7 | 3,573.2 | 4,779.6 | 4,239.4 | 4,341.7 | |||||||||||||||
|
|
|
|
|
|
|
|
|
|
|
|||||||||||
| Total |
¥ | 22,937.1 | ¥ | 21,334.0 | ¥ | 27,866.7 | ¥ | 30,702.3 | ¥ | 27,849.8 | ||||||||||
|
|
|
|
|
|
|
|
|
|
|
|||||||||||
| (a) | Starting with transactions recognized in January 2014, the BOJ began using the Sixth Edition of “Balance of Payments and International Investment Position Manual” (BPM6) released by International Monetary Fund in 2008 to calculate the data provided in this table. |
Source: Outward / Inward Direct Investment, breakdown by Region and Industry, Ministry of Finance.
28
The BOJ, with 55% of its capital owned by the government, is the central bank and sole issuing bank, as well as the depository and fiscal agent for the government. As of the end of March 2026, the BOJ had total assets of ¥663,025 billion.
In a statement released on March 19, 2024, noting that the price stability target of 2% would be achieved in a sustainable and stable manner toward the end of the projection period of the January 2024 Outlook Report, the BOJ announced that it would end its policy of QQE with Yield Curve Control and the negative interest rate policy, and that it would conduct monetary policy as appropriate, guiding the short-term interest rate as a primary policy tool, in response to developments in economic activity and prices as well as financial conditions with the 2% price stability target. In addition, while continuing Japanese government bond (JGB) purchases with broadly the same amounts as before, the BOJ announced that it would discontinue purchases of exchange-traded funds (ETFs) and Japan real estate investment trusts (J-REITs). In a statement released on July 31, 2024, the BOJ announced that it would encourage the uncollateralized overnight call rate to remain at around 0.25% and that it would reduce the amount of its monthly outright purchases of JGBs to about 3 trillion yen in January through March 2026, with the amount to be cut down by about 400 billion yen each calendar quarter in principle. In a statement released on January 24, 2025, the BOJ announced that it would encourage the uncollateralized overnight call rate to remain at around 0.5%. In a statement released on June 17, 2025, the BOJ announced that it would reduce the amount of its monthly outright purchases of JGBs to about 2 trillion yen in January through March 2027. The amount would be cut down, in principle, by about 400 billion yen each calendar quarter until January through March 2026, and by about 200 billion yen each calendar quarter from April through June 2026. In a statement released on September 19, 2025, the BOJ announced that it would sell its holdings of ETFs and J-REITs to the market. In a statement released on December 19, 2025, the BOJ announced that it would encourage the uncollateralized overnight call rate to remain at around 0.75%. In a statement released on June 16, 2026, the BOJ announced that it would encourage the uncollateralized overnight call rate to remain at around 1.0% and that it would reduce the planned amount of its monthly purchases of JGBs by, in principle, about 200 billion yen each calendar quarter until January through March 2027. It also announced that, from April 2027, the amount of its monthly purchases of JGBs would be about 2 trillion yen.
The following table sets forth the principal economic indicators relating to monetary policy from 2021 through 2025.
| Current Account Balances(a) |
Monetary Base | Money Stock | Loans and Bills Discounts Domestically Licensed Banks |
|||||||||||||||||||||||
| Total(a) | Annual % Change |
Total(a) | Annual % Change |
Total(a) | Annual % Change |
|||||||||||||||||||||
| (yen amounts in billions) | ||||||||||||||||||||||||||
| 2021 |
521,752 | 643,496 | 16.2 | 1,162,665 | 6.5 | 536,911 | 2.4 | |||||||||||||||||||
| 2022 |
528,008 | 653,203 | 1.6 | 1,201,202 | 3.3 | 550,559 | 2.5 | |||||||||||||||||||
| 2023 |
537,246 | 663,655 | 1.8 | 1,231,147 | 2.5 | 573,597 | 4.2 | |||||||||||||||||||
| 2024 |
545,121 | 670,305 | 1.0 | 1,252,373 | 1.7 | 597,212 | 4.1 | |||||||||||||||||||
| 2025 |
514,492 | 637,258 | (5.0 | ) | 1,267,178 | 1.2 | 622,322 | 4.2 | ||||||||||||||||||
| (a) | Average amounts outstanding. |
Source: Bank of Japan Statistics, Bank of Japan.
Government Financial Institutions
The activities of private institutions are supplemented by a number of financial institutions under government supervision, the appointment of whose senior officials is subject to approval by the government and whose funds are supplied principally or partially by the government. Among these are Japan Finance Corporation (“JFC”), the successor to National Life Finance Corporation (“NLFC”), Japan Finance Corporation for Small and Medium Enterprise (“JASME”), and Agriculture, Forestry and Fisheries Finance Corporation (“AFC”), whose main purposes are to contribute to the improvement of the quality of the national life. They also include Japan Bank for International Cooperation (“JBIC”) and The Okinawa Development Finance Corporation, whose purposes are to supplement private financing in their respective fields of activity, and Development Bank of Japan Inc. (“DBJ”) and The Shoko Chukin Bank Ltd., which will be privatized.
The central government has been steadily promoting reform of governmental financial institutions. The “Outline of Administrative Reforms” decided by the Cabinet on December 1, 2000, requires that the businesses and organizational forms of all special public institutions, which include governmental financial institutions, undergo a thorough review. Pursuant to the Act on Promotion of Administrative Reform for Realization of Small and Efficient Government, which was enacted on May 26, 2006, (1) the former Development Bank of Japan was succeeded to by DBJ as of October 1, 2008, which is currently wholly owned by the Japanese government and will be privatized as well as The Shoko Chukin Bank Ltd., (2) the international financial operations of JBIC, together with the functions of NLFC, JASME, AFC were transferred to JFC as of October 1, 2008, and the overseas economic cooperation operations of JBIC were transferred to the Japan International Cooperation Agency, and (3) as of October 1, 2008, Japan Finance Corporation for Municipal Enterprises was succeeded by Japan Finance Organization for Municipalities, which is funded by local governments. Each of these measures was implemented through individual laws that were enacted in 2007, pursuant to which these successor institutions were formed on October 1, 2008.
29
With regard to (1) above, as originally enacted, the Development Bank of Japan Inc. Act (Act No. 85 of 2007), as amended (the “DBJ Act”), contemplated full privatization of DBJ over a period of five to seven years from its establishment on October 1, 2008. During that period, the DBJ Act (as originally enacted) provided that the Japanese government would dispose of all of the common stock of DBJ (the “full privatization”), and that steps would be taken to abolish this act promptly after the full privatization. On June 26, 2009, the Japanese Diet approved the Act for Partial Amendment of the Development Bank of Japan Inc. Act (Act No. 67 of 2009) (the “2009 Amendment Act”), which, as part of the Japanese government’s response to economic and financial crises, enables the Japanese government to strengthen DBJ’s financial base through capital injections up to the end of March 2012. In addition, under the 2009 Amendment Act, the targeted timing for the full privatization of DBJ had been extended to approximately five to seven years from April 1, 2012. Further, the 2009 Amendment Act provided that the Japanese government was to review the organization of DBJ, including whether the Japanese government should keep holding the DBJ shares, by the end of fiscal year 2011, and until then, the Japanese government should not be disposing of the DBJ’s shares. Additionally, on May 2, 2011, in order to address the Earthquake, the Japanese Diet approved the Act for Extraordinary Expenditure and Assistance to Cope with the Great East Earthquake (Act No. 40 of 2011) (the “Extraordinary Expenditure Act”). The Extraordinary Expenditure Act enabled the Japanese government to strengthen DBJ’s financial base through capital injection by March 2015 so that DBJ could smoothly implement its crisis response operations. In addition, under Extraordinary Expenditure Act, the targeted timing for the full privatization of DBJ had been extended to approximately five to seven years from April 1, 2015. Further, the Extraordinary Expenditure Act provided that the Japanese government was to review the organization of DBJ, including whether the Japanese government should keep holding the DBJ’s shares by the end of fiscal year 2014, and until such time, the Japanese government shall not dispose of the DBJ’s shares. On May 13, 2015, the Japanese Diet approved the Act for Partial Amendment of the Development Bank of Japan Inc. Act (Act No. 23 of 2015) (the “2015 Amendment Act”), under which the specific targeted timing for the full privatization of DBJ was withdrawn, taking into consideration the current business environment in the private financial sector. The 2015 Amendment Act allowed DBJ to take actions necessary for the implementation of Crisis Response Operations and the supply of growth capital by utilizing its investment and loan functions (“Special Investment Operations”). That is, DBJ would take measures to provide funding in response to large-scale disasters, economic crises and so forth, and to promote supply of the growth capital to revitalize regional economies and enhance the competitiveness of enterprises. In order to ensure implementation of these necessary operations, under the 2015 Amendment Act, the Japanese government is required to maintain a stake of more than one-third for DBJ’s Crisis Response Operations and a stake of one-half or more for its Special Investment Operations, for as long as such measures are in place. Furthermore, on May 22, 2020, the Act for Partial Amendment of the Development Bank of Japan Inc. Act (Act No. 29 of 2020) was promulgated, under which the duration of DBJ’s Special Investment Operations has been extended by five years. Additionally, under partial amendments to the DBJ Act effective in 2025 (Act No. 36 of 2025), the completion date of DBJ’s Special Investment Operations has been extended to March 31, 2041.
With regard to (2) above, The Japan Bank for International Cooperation Act (the “JBIC Act”) was passed into law on April 28, 2011 to spin off the Japan Bank for International Cooperation Operations from the domestic financial operations of the Japan Finance Corporation. Pursuant to the JBIC Act, Japan Bank for International Cooperation was newly established on April 1, 2012.
Private Financial Institutions
According to the Financial Services Agency, as of April 1, 2026, the private banking system included 4 city banks, 13 trust banks, and 18 other banks, as well as 61 1st local banks as of May 26, 2026, 34 2nd local banks as of May 2, 2026 and the Saitama Resona Bank, which is categorized as neither a 1st nor 2nd local bank. In addition, 57 foreign banks had branches in Japan as of May 13, 2026.
There are also credit associations, credit cooperative associations, labor credit associations and the national federations of each of such associations, which are engaged mainly in making small business loans. Agricultural cooperatives, prefectural credit federations of such cooperatives and The Norinchukin Bank operate in the field of agricultural credit.
30
Revenues, Expenditures and Budgets
The responsibility for the preparation of the budget and the administration of government finances rests with the Ministry of Finance. The fiscal year commences on April 1, and the Cabinet usually submits the budget to the Diet for its decision in the preceding January. Supplementary budgets revising the original budget may be submitted to the Diet from time to time during the fiscal year.
The fiscal and financial operations of the government and its agencies are budgeted and recorded in the following three sets of accounts:
| • | General Account. The general account is used primarily to record operations in basic areas of governmental activity. |
| • | Special Accounts. The accounts of the central government consist of the general account and special accounts. Special accounts can be set up to carry out specific projects, to manage specific funds, and for other purposes. Special accounts can be set up when the government (i) implements a specific program such as insurance and public works, (ii) possesses and manages special funds such as Fiscal Loan Program Funds and Foreign Exchange Funds, and (iii) uses a certain revenue to secure a special expenditure and thus needs to deal with such revenue and expenditure on a separate basis from the general revenue and expenditure such as Local Allocation and Local Transfer Tax and Government Bonds Consolidation Funds. As of September 2025, the government had 14 special accounts for JFY 2026. |
| • | Government-Affiliated Agencies. The government-affiliated agencies are fully-government-funded corporations established by the law which budget would be discussed in the Diet. |
31
The settlement of accounts for revenues and expenditures is made by the Ministry of Finance, based on reports submitted by the respective Ministers. The settlement of accounts is required by law to be audited annually in detail by the Board of Audit, an organ independent of the Cabinet, and submitted by the Cabinet to the Diet in the following fiscal year.
The following tables set forth information with respect to the General Account, the Special Accounts and the Government Affiliated Agencies for JFY 2020 through JFY 2025, and the initial budget for JFY 2026.
Summary of Consolidated General and Special Accounts(a)
| JFY 2020 |
JFY 2021 |
JFY 2022 |
JFY 2023 |
JFY 2024 |
JFY 2025 (Provisional results as of December 31, 2025) |
JFY 2026 Initial Budget |
||||||||||||||||||||||
| (in billions of yen) | ||||||||||||||||||||||||||||
| REVENUES |
||||||||||||||||||||||||||||
| Total Revenues, General Account |
¥ | 184,579 | ¥ | 169,403 | ¥ | 153,729 | ¥ | 140,202 | ¥ | 135,981 | ¥ | 143,782 | ¥ | 122,309 | ||||||||||||||
| Total Revenues, Special Accounts |
417,561 | 455,554 | 447,892 | 428,265 | 425,699 | 443,002 | 445,481 | |||||||||||||||||||||
| Less: Inter-Account Transactions(b) |
248,863 | 302,306 | 296,356 | 294,130 | 277,067 | 293,038 | 298,415 | |||||||||||||||||||||
|
|
|
|
|
|
|
|
|
|
|
|
|
|
|
|||||||||||||||
| Total Consolidated Revenues |
¥ | 353,277 | ¥ | 322,651 | ¥ | 305,266 | ¥ | 274,337 | ¥ | 284,612 | ¥ | 293,746 | ¥ | 269,376 | ||||||||||||||
|
|
|
|
|
|
|
|
|
|
|
|
|
|
|
|||||||||||||||
| EXPENDITURES |
||||||||||||||||||||||||||||
| Total Expenditures, General Account |
¥ | 147,597 | ¥ | 144,650 | ¥ | 132,386 | ¥ | 127,579 | ¥ | 123,024 | ¥ | 143,118 | ¥ | 122,309 | ||||||||||||||
| Total Expenditures, Special Accounts |
404,519 | 441,081 | 432,354 | 412,534 | 407,395 | 432,073 | 441,726 | |||||||||||||||||||||
| Less: Inter-Account Transactions(b) |
246,270 | 300,383 | 294,929 | 291,293 | 275,052 | 289,835 | 295,215 | |||||||||||||||||||||
|
|
|
|
|
|
|
|
|
|
|
|
|
|
|
|||||||||||||||
| Total Consolidated Expenditures |
¥ | 305,846 | ¥ | 285,348 | ¥ | 269,810 | ¥ | 248,820 | ¥ | 255,367 | ¥ | 285,356 | ¥ | 268,821 | ||||||||||||||
|
|
|
|
|
|
|
|
|
|
|
|
|
|
|
|||||||||||||||
| Surplus of Consolidated Revenues over Consolidated Expenditures |
¥ | 47,431 | ¥ | 37,303 | ¥ | 35,456 | ¥ | 25,517 | ¥ | 29,245 | ¥ | 8,390 | ¥ | 555 | ||||||||||||||
| (a) | Because of the manner in which the government accounts are kept, it is not practicable to show a consolidation of the Government Affiliated Agencies with the General and Special Accounts. |
| (b) | Inter-Account Transactions include transfers between the General Account and the Special Accounts, transfers between the Special Accounts, and transfers between sub- accounts of the Special Accounts. |
Source: Budget, Ministry of Finance.
32
General Account
| JFY 2020 |
JFY 2021 |
JFY 2022 |
JFY 2023 |
JFY 2024 |
JFY 2025 Revised Budget(a) |
JFY 2026 Initial Budget |
||||||||||||||||||||||
| (in billions of yen) | ||||||||||||||||||||||||||||
| REVENUES |
||||||||||||||||||||||||||||
| Tax and Stamp Revenues |
¥ | 60,822 | ¥ | 67,038 | ¥ | 71,137 | ¥ | 72,076 | ¥ | 73,435 | ¥ | 77,819 | ¥ | 83,735 | ||||||||||||||
| Carried-over Surplus |
7,796 | 36,981 | 24,754 | 21,344 | 1,559 | — | — | |||||||||||||||||||||
| Government Bond Issues |
108,554 | 57,655 | 50,479 | 34,998 | 42,139 | 28,647 | 29,584 | |||||||||||||||||||||
| Income from Operations |
46 | 61 | 60 | 58 | 55 | 52 | 64 | |||||||||||||||||||||
| Gains from Deposition of Assets |
293 | 319 | 369 | 764 | 248 | 291 | 181 | |||||||||||||||||||||
| Miscellaneous Receipts |
7,068 | 7,349 | 6,930 | 10,962 | 9,078 | 8,389 | 8,754 | |||||||||||||||||||||
|
|
|
|
|
|
|
|
|
|
|
|
|
|
|
|||||||||||||||
| Total Revenues |
¥ | 184,579 | ¥ | 169,403 | ¥ | 153,729 | ¥ | 140,202 | ¥ | 126,515 | ¥ | 115,198 | ¥ | 122,309 | ||||||||||||||
|
|
|
|
|
|
|
|
|
|
|
|
|
|
|
|||||||||||||||
| EXPENDITURES |
||||||||||||||||||||||||||||
| Local Allocation Tax Grants, etc. |
¥ | 16,256 | ¥ | 19,558 | ¥ | 17,513 | ¥ | 17,181 | ¥ | 19,620 | ¥ | 18,873 | ¥ | 20,877 | ||||||||||||||
| National Debt Service |
22,326 | 24,589 | 23,870 | 25,501 | 25,908 | 28,218 | 31,276 | |||||||||||||||||||||
| Social Security |
42,998 | 50,161 | 43,868 | 36,222 | 38,647 | 38,294 | 39,056 | |||||||||||||||||||||
| Public Works |
8,413 | 8,600 | 8,126 | 8,204 | 8,432 | 6,086 | 6,108 | |||||||||||||||||||||
| Education and Science |
9,194 | 7,956 | 8,669 | 8,160 | 6,717 | 5,656 | 6,041 | |||||||||||||||||||||
| National Defense |
5,505 | 6,014 | 5,529 | 11,547 | 8,850 | 8,669 | 8,984 | |||||||||||||||||||||
| Former Military Personnel Pensions |
169 | 140 | 113 | 89 | 78 | 62 | 49 | |||||||||||||||||||||
| Economic Assistance |
763 | 669 | 900 | 768 | 741 | 505 | 511 | |||||||||||||||||||||
| Food Supply |
1,498 | 1,772 | 1,947 | 1,726 | 1,726 | 1,261 | 1273 | |||||||||||||||||||||
| Energy |
1,027 | 1,267 | 2,001 | 1,190 | 2,405 | 811 | 800 | |||||||||||||||||||||
| Promotion of SMEs |
16,257 | 9,944 | 3,396 | 471 | 759 | 169 | 170 | |||||||||||||||||||||
| Miscellaneous |
23,190 | 13,980 | 16,453 | 16,520 | 10,632 | 5,854 | 6,164 | |||||||||||||||||||||
| Contingency funds for measures to address soaring crude oil and commodity prices and to set up environment for promoting wage increases |
— | — | — | — | 1,000 | — | — | |||||||||||||||||||||
| Contingencies |
— | — | — | — | 1,000 | 739 | 1,000 | |||||||||||||||||||||
|
|
|
|
|
|
|
|
|
|
|
|
|
|
|
|||||||||||||||
| Total Expenditures |
¥ | 147,597 | ¥ | 144,650 | ¥ | 132,386 | ¥ | 127,579 | ¥ | 126,515 | ¥ | 115,198 | ¥ | 122,309 | ||||||||||||||
|
|
|
|
|
|
|
|
|
|
|
|
|
|
|
|||||||||||||||
| Surplus of Revenues over Expenditures |
¥ | 36,981 | ¥ | 24,754 | ¥ | 21,344 | ¥ | 12,623 | ¥ | — | ¥ | — | ¥ | — | ||||||||||||||
| (a) | As of the date of this Annual Report on Form 18-K, details for the provisional results for JFY 2025 General Accounts are not available. Reflect the revised budget for JFY 2025 approved by the Diet on March 31, 2025. |
Source: Budget, Ministry of Finance.
33
Special Accounts
| JFY 2020 |
JFY 2021 |
JFY 2022 |
JFY 2023 |
JFY 2024 |
JFY 2025 Revised Budget |
JFY 2026 Initial Budget |
||||||||||||||||||||||||||||||||||||||||||||||||||
| Rev. | Exp. | Rev. | Exp. | Rev. | Exp. | Rev. | Exp. | Rev. | Exp. | Rev. | Exp. | Rev. | Exp. | |||||||||||||||||||||||||||||||||||||||||||
| (in billions of yen) | ||||||||||||||||||||||||||||||||||||||||||||||||||||||||
| Fiscal Investment and Loan Program |
¥ | 52,366 | ¥ | 51,967 | ¥ | 35,860 | ¥ | 35,346 | ¥ | 34,069 | ¥ | 33,378 | ¥ | 14,419 | ¥ | 14,023 | ¥ | 23,889 | ¥ | 23,432 | ¥ | 24,459 | ¥ | 24,423 | ¥ | 27,466 | ¥ | 27,439 | ||||||||||||||||||||||||||||
| Government Bonds Consolidation Fund |
188,973 | 185,921 | 239,702 | 236,623 | 235,623 | 232,556 | 234,483 | 231,413 | 216,834 | 213,709 | 220,716 | 220,716 | 224,829 | 224,829 | ||||||||||||||||||||||||||||||||||||||||||
| Foreign Exchange Fund |
3,133 | 234 | 2,475 | 177 | 3,590 | 114 | 5,250 | 1,361 | 5,713 | 353 | 4,943 | 1,546 | 4,825 | 1,973 | ||||||||||||||||||||||||||||||||||||||||||
| Local Allocation and Local Transfer Tax |
51,978 | 50,829 | 55,326 | 53,632 | 53,624 | 51,778 | 52,895 | 51,662 | 54,434 | 53,221 | 53,113 | 52,206 | 51,307 | 51,065 | ||||||||||||||||||||||||||||||||||||||||||
| Measure for Energy |
11,155 | 10,618 | 11,649 | 10,914 | 11,893 | 11,021 | 13,537 | 12,223 | 13,663 | 12,320 | 17,065 | 17,065 | 16,921 | 16,921 | ||||||||||||||||||||||||||||||||||||||||||
| Pensions |
94,591 | 91,804 | 96,376 | 92,725 | 97,191 | 92,929 | 95,466 | 91,402 | 98,610 | 93,662 | 100,318 | 100,318 | 102,927 | 102,927 | ||||||||||||||||||||||||||||||||||||||||||
| Child Welfare |
— | — | — | — | — | — | — | — | — | — | 5,887 | 5,887 | 5,901 | 5,901 | ||||||||||||||||||||||||||||||||||||||||||
| Stable Supply of Foodstuff |
926 | 821 | 980 | 913 | 1,254 | 1,151 | 1,171 | 1,093 | 1,131 | 1,001 | 1,338 | 1,317 | 1,311 | 1,294 | ||||||||||||||||||||||||||||||||||||||||||
| Debt Management of National Forest and Field Service |
363 | 363 | 360 | 360 | 353 | 353 | 343 | 343 | 340 | 340 | 334 | 334 | 331 | 331 | ||||||||||||||||||||||||||||||||||||||||||
| Automobile Safety |
651 | 434 | 559 | 395 | 569 | 426 | 595 | 435 | 616 | 414 | 1,097 | 471 | 563 | 492 | ||||||||||||||||||||||||||||||||||||||||||
| Labor Insurance |
10,589 | 9,519 | 10,486 | 8,610 | 8,289 | 7,536 | 8,899 | 7,727 | 9,300 | 8,231 | 7,913 | 7,556 | 8,051 | 7,634 | ||||||||||||||||||||||||||||||||||||||||||
| Reconstruction from the Great East Japan Earthquake |
2,498 | 1,854 | 1,430 | 1,112 | 1,114 | 894 | 861 | 704 | 788 | 565 | 768 | 768 | 633 | 633 | ||||||||||||||||||||||||||||||||||||||||||
| Others |
338 | 153 | 353 | 273 | 323 | 217 | 346 | 148 | 380 | 149 | 380 | 272 | 418 | 287 | ||||||||||||||||||||||||||||||||||||||||||
|
|
|
|
|
|
|
|
|
|
|
|
|
|
|
|
|
|
|
|
|
|
|
|
|
|
|
|
|
|||||||||||||||||||||||||||||
| Total Revenues and Expenditures |
¥ | 417,561 | ¥ | 404,519 | ¥ | 455,554 | ¥ | 441,081 | ¥ | 447,892 | ¥ | 432,354 | ¥ | 428,265 | ¥ | 412,534 | ¥ | 425,699 | ¥ | 407,395 | ¥ | 438,330 | ¥ | 432,879 | ¥ | 445,481 | ¥ | 441,726 | ||||||||||||||||||||||||||||
|
|
|
|
|
|
|
|
|
|
|
|
|
|
|
|
|
|
|
|
|
|
|
|
|
|
|
|
|
|||||||||||||||||||||||||||||
| (a) | As of the date of this Annual Report on Form 18-K, details for the provisional results for JFY 2025 Special Accounts are not available. Reflect the revised budget for JFY 2025 approved by the Diet on March 31, 2025. |
| (b) | Without adjustment for inter-account transactions. Total Revenues and Expenditures may differ from the actual totals of the listed accounts due to rounding. |
Source: Budget, Ministry of Finance.
34
Government Affiliated Agencies
| JFY 2020 |
JFY 2021 |
JFY 2022 |
JFY 2023 |
JFY 2024 |
JFY 2025 Revised Budget(a) |
JFY 2026 Initial Budget |
||||||||||||||||||||||||||||||||||||||||||||||||||
| Rev. | Exp. | Rev. | Exp. | Rev. | Exp. | Rev. | Exp. | Rev. | Exp. | Rev. | Exp. | Rev. | Exp. | |||||||||||||||||||||||||||||||||||||||||||
| (in billions of yen) | ||||||||||||||||||||||||||||||||||||||||||||||||||||||||
| Total |
¥ | 1,096 | ¥ | 804 | ¥ | 996 | ¥ | 665 | ¥ | 1,269 | ¥ | 1,024 | ¥ | 1,976 | ¥ | 1,816 | ¥ | 2,079 | ¥ | 2,045 | ¥ | 2,871 | ¥ | 3,336 | ¥ | 4,283 | ¥ | 4,717 | ||||||||||||||||||||||||||||
| (a) | There were no revisions to the relevant information for Government Affiliated Agencies in the first revised budget for JFY 2025 approved by the Diet on December 17, 2025. As of the date of this Annual Report on Form 18-K, details for the provisional results for JFY 2025 Government Affiliated Agencies are not available. |
Source: Budget, Ministry of Finance.
35
The central government derives tax revenues (including stamp revenues) through taxes on income, consumption and property, etc. The taxes on income, consumption and property (including stamp revenues, etc.) account for 58.1%, 36.5% and 5.4%, respectively, of the total central government taxes and stamp revenues in the JFY 2026 initial national budget.
The individual national income tax is progressive, with rates currently ranging from 5% to 45% of taxable income, and the local income taxes are a 10% single rate. Interest income is generally taxed at the rate of 20.315%, including both national and local income taxes, separately from other types of income, and subject to certain exemptions. The statutory national corporate income tax rate is 23.2%, except that, for small and medium corporations, the first ¥8 million of income is taxed at 15% (17% for fiscal years in which the amount of income exceeds ¥1 billion). In addition, corporations are subject to local income taxation. For fiscal years beginning on or after April 1, 2026, the Special Defense Corporate Tax will be imposed. The amount of the Special Defense Corporate Tax is calculated by applying a tax rate of 4 percent to the amount obtained by deducting 5 million JPY from the standard amount of corporate tax. Starting from April 1, 2026, the effective corporate income tax rate (national and local) applicable to enterprises other than small and medium-sized enterprises that are subject to the Special Defense Corporate Tax is 30.64% (calculated without taking into account the deduction for the Special Defense Corporate Tax).
Comprehensive Reform of Social Security and Tax. Japan’s fiscal conditions face challenges, with its tax revenues covering about 68% of its revenues under the initial budget for JFY 2026, and with the ratio of long-term debt outstanding of central and local governments to gross domestic product having reached 200% at the end of JFY 2024. The ratio of long-term debt outstanding of central and local governments to gross domestic product is expected to be decreased to 199% at the end of JFY 2025 and then decreased to 194% at the end of JFY 2026. See also “Japan’s Public Debt” below. The Government of Japan seeks to tackle these fiscal challenges through the “comprehensive reform of social security and tax”, which was approved by the Diet in August 2012, and thereby maintain the market’s and the international community’s confidence in Japan and build the foundation for stable economic growth. In the reform, the government planned to set aside consumption tax revenues for social security payments, and, on the condition that the economic situation improves, gradually increase the consumption tax rate to 8% in April 2014 and to 10% in October 2015. In accordance with the plan, the consumption tax rate was increased to 8% in April 2014. Then, after several postponements, the consumption tax rate has been increased to 10% since October, 2019.
Fiscal Investment and Loan Program
The Fiscal Investment and Loan Program (the “FILP”) plan is formulated at the same pace as the General Account budget. The FILP plan details the allocation of public funds to various special accounts, government affiliated agencies, local governments, public corporations and other public institutions.
Under the FILP plan, funds are supplied to government-related entities such as public corporations, government affiliated agencies, special accounts and local governments. The total amount of the initial plan for JFY 2026 is ¥19,018 billion. The sources of funds for the initial plan in JFY 2026 are Fiscal Loan (¥12,716 billion), Industrial Investment (¥500 billion), Government-Guaranteed domestic bonds (¥1,057 billion), Government-Guaranteed foreign bonds (¥4,705 billion) and Government-Guaranteed long-term borrowings in foreign currencies (¥40 billion). The Fiscal Loan utilizes the Fiscal Loan Fund consisting of funds procured through the issuance of FILP bonds and reserves or surplus funds deposited from government special accounts to provide long-term, fixed and low-interest loans to such entities as special government accounts, local governments, government-affiliated agencies and incorporated administrative agencies.
The following table (the “FILP Classification Table by Purpose”) shows the uses of funds allocated under the initial plan for the periods indicated.
| (Note) | The FILP Classification Table by Purpose has been prepared and published to specify fields where FILP contributes to the national economy or livelihood. Classification of the table had been almost the same from JFY 1961 to JFY 2014. However, since the classification became to be inappropriate for reflecting realities of recent FILP-target projects, it was revised in JFY 2015 by sorting out the classification or putting some classifications together. |
36
FILP Classification Table by Purpose
| Old classification |
JFY 2011 | JFY 2012 | JFY 2013 | JFY 2014 | ||||||||||||
| (in billions of yen) | ||||||||||||||||
| Housing |
¥ | 578 | ¥ | 923 | ¥ | 929 | ¥ | 942 | ||||||||
| Living environment |
2,725 | 2,713 | 2,805 | 2,306 | ||||||||||||
| Social welfare |
550 | 743 | 703 | 920 | ||||||||||||
| Education |
1,176 | 1,232 | 1,522 | 1,278 | ||||||||||||
| Small and medium enterprises |
3,627 | 4,323 | 4,197 | 3,861 | ||||||||||||
| Agriculture, forestry and fisheries |
345 | 373 | 407 | 476 | ||||||||||||
| National land conservation/disaster recovery |
180 | 645 | 348 | 477 | ||||||||||||
| Road construction |
2,248 | 2,813 | 2,939 | 2,270 | ||||||||||||
| Transportation/communications |
408 | 384 | 519 | 629 | ||||||||||||
| Regional development |
467 | 447 | 372 | 259 | ||||||||||||
| Industry/technology |
625 | 2,015 | 2,005 | 1,448 | ||||||||||||
| Trade/economic cooperation |
1,978 | 1,039 | 1,644 | 1,313 | ||||||||||||
|
|
|
|
|
|
|
|
|
|||||||||
| Total |
¥ | 14,906 | ¥ | 17,648 | ¥ | 18,390 | ¥ | 16,180 | ||||||||
|
|
|
|
|
|
|
|
|
|||||||||
| New classification |
JFY 2015 | JFY 2016 | JFY 2017 | JFY 2018 | JFY 2019 | JFY 2020 | ||||||||||||||||||
| (in billions of yen) | ||||||||||||||||||||||||
| SMEs and micro enterprises |
¥ | 3,448 | ¥ | 3,182 | ¥ | 2,969 | ¥ | 2,912 | ¥ | 2,997 | ¥ | 2,903 | ||||||||||||
| Agriculture, forestry and fisheries |
280 | 322 | 339 | 573 | 604 | 590 | ||||||||||||||||||
| Education |
1,038 | 1,055 | 932 | 943 | 930 | 898 | ||||||||||||||||||
| Welfare/medical care |
773 | 811 | 670 | 627 | 541 | 477 | ||||||||||||||||||
| Environment |
61 | 61 | 64 | 61 | 33 | 54 | ||||||||||||||||||
| Industry/innovation |
939 | 864 | 822 | 919 | 1,019 | 1,166 | ||||||||||||||||||
| Housing |
742 | 621 | 541 | 461 | 546 | 521 | ||||||||||||||||||
| Public infrastructure |
3,999 | 3,087 | 5,093 | 4,761 | 3,745 | 3,752 | ||||||||||||||||||
| Overseas investment and loans |
1,378 | 2,000 | 2,455 | 2,003 | 1,857 | 2,039 | ||||||||||||||||||
| Others |
1,964 | 1,477 | 1,243 | 1,204 | 849 | 821 | ||||||||||||||||||
|
|
|
|
|
|
|
|
|
|
|
|
|
|||||||||||||
| Total |
¥ | 14,622 | ¥ | 13,481 | ¥ | 15,128 | ¥ | 14,463 | ¥ | 13,119 | ¥ | 13,220 | ||||||||||||
|
|
|
|
|
|
|
|
|
|
|
|
|
|||||||||||||
| New classification |
JFY 2021 | JFY 2022 | JFY 2023 | JFY 2024 | JFY 2025 | JFY 2026 | ||||||||||||||||||
| (in billions of yen) | ||||||||||||||||||||||||
| SMEs and micro enterprises |
¥ | 14,521 | ¥ | 3,567 | ¥ | 4,972 | ¥ | 2,965 | ¥ | 2,258 | ¥ | 1,934 | ||||||||||||
| Agriculture, forestry and fisheries |
759 | 699 | 796 | 772 | 682 | 756 | ||||||||||||||||||
| Education |
4,859 | 5,671 | 805 | 823 | 785 | 838 | ||||||||||||||||||
| Welfare/medical care |
2,042 | 1,044 | 436 | 442 | 360 | 441 | ||||||||||||||||||
| Environment |
57 | 93 | 101 | 93 | 113 | 149 | ||||||||||||||||||
| Industry/innovation |
1,213 | 1,009 | 1,052 | 1,134 | 1,085 | 1,169 | ||||||||||||||||||
| Housing |
792 | 815 | 768 | 808 | 630 | 708 | ||||||||||||||||||
| Public infrastructure |
3,065 | 2,634 | 2,921 | 2,743 | 2,414 | 2,531 | ||||||||||||||||||
| Overseas investment and loans |
2,029 | 2,472 | 3,543 | 2,993 | 3,555 | 10,393 | ||||||||||||||||||
| Others |
11,568 | 884 | 875 | 563 | 300 | 100 | ||||||||||||||||||
|
|
|
|
|
|
|
|
|
|
|
|
|
|||||||||||||
| Total |
¥ | 40,906 | ¥ | 18,886 | ¥ | 16,269 | ¥ | 13,338 | ¥ | 12,182 | ¥ | 19,018 | ||||||||||||
|
|
|
|
|
|
|
|
|
|
|
|
|
|||||||||||||
37
There has been no default in the payment of interest or principal of any internal Japanese government obligation since the establishment of the modern Japanese state in 1868 or of any external Japanese government obligation within a period of 20 years prior hereto.
The following table summarizes, as of the dates indicated, the outstanding direct internal and external funded and floating debt of Japan. The term “floating debt” is used herein to mean all debt with maturities of one year or less from the date of issue. All other debt is classified as “funded debt.” Detailed debt tables are presented below.
Outstanding General Bonds are expected to reach ¥1,145 trillion at the end of JFY 2026. The amount of public bonds issued by the Japanese government as a percentage of its general account total revenues was 30.2% under the revised budget for JFY 2025 (reflecting the first supplementary budget approved on December 16, 2025) and 24.2% under the initial budget for JFY 2026. The amount of the general bond issuances in the JFY 2026 initial budget is ¥29,584 billion and is less than the JFY 2025 revised budget level of ¥40,343 billion.
Summary of Japan’s Public Debt
| Funded | Floating Internal | ||||||||||||||
| At the end of JFY |
Internal | External | |||||||||||||
| (in billions) | (in thousands) | (in billions) | |||||||||||||
| 2021 |
¥ | 1,037,735 | — | ¥ | 203,572 | ||||||||||
| 2022 |
1,072,905 | — | 197,594 | ||||||||||||
| 2023 |
1,107,223 | — | 189,938 | ||||||||||||
| 2024 |
1,137,675 | — | 186,041 | ||||||||||||
| 2025 |
1,159,660 | — | 184,621 | ||||||||||||
As of March 31, 2026 Japan had guaranteed payment of principal and interest of various internal yen obligations in the aggregate principal amount of ¥18,617 billion and of various external obligations aggregating the equivalent of ¥8,037 billion
The following table sets forth the aggregate annual payments of principal in respect of the direct internal funded debt of Japan outstanding as of March 31, 2026 for the periods indicated.
Principal Payments on Direct Funded Debt of Japan
| JFY |
Internal | |||
| (in billions) | ||||
| 2026 |
¥ | 116,913 | ||
| 2027 |
119,197 | |||
| 2028 |
83,026 | |||
| 2029 |
84,225 | |||
| 2030 to 2064 |
756,258 | |||
|
|
|
|||
| Total |
¥ | 1,159,619 | ||
|
|
|
|||
38
Direct Debt of the Japanese Government
Funded Debt
| Title and Interest Rate |
Year of Issue | Year of Maturity | Principal Amounts Outstanding as of March 31, 2026 (in millions) |
|||||||||
| 1. Bonds |
||||||||||||
| Interest-Bearing Treasury Bond — 40 years, 18 Series (0.4-3.1%) |
2007-2026 | 2048-2065 | ¥ | 53,869,967 | ||||||||
| Interest-Bearing Treasury Bond — 30 years, 89 Series (0.3-3.4%) |
1999-2026 | 2029-2055 | 201,906,901 | |||||||||
| Interest-Bearing Treasury Bond — 20 years, 108 Series (0.2-3.2%) |
2006-2026 | 2026-2045 | 317,757,642 | |||||||||
| Interest-Bearing Treasury Bond — 10 years, 39 Series (0.1-2.1%) |
2016-2026 | 2026-2035 | 328,437,963 | |||||||||
| Interest-Bearing Treasury Bond for Individual Investors — 10 years, 120 Series (variable rate) |
2016-2026 | 2026-2036 | 12,978,816 | |||||||||
| Inflation-Indexed Bonds —10 years, 9 Series (0.005-0.2%) |
2017-2026 | 2027-2035 | 9,691,943 | |||||||||
| Japan Climate Transition Bond — 10 years, 4 Series (0.7-2.1%) |
2024-2026 | 2033-2035 | 2,098,800 | |||||||||
| Interest-Bearing Treasury Bond — 5 years, 36 Series (0.005-1.6%) |
2021-2026 | 2026-2030 | 148,457,503 | |||||||||
| Interest-Bearing Treasury Bond for Individual Investors — 5 years, 60 Series (0.05-1.66%) |
2021-2026 | 2026-2031 | 4,845,312 | |||||||||
| Japan Climate Transition Bond— 5 years, 4 Series (0.5-1.6%) |
2024-2026 | 2028-2030 | 2,098,900 | |||||||||
| Interest-Bearing Treasury Bond for Individual Investors — 3 years, 36 Series (0.05-1.39%) |
2023-2026 | 2026-2029 | 1,730,451 | |||||||||
| Interest-Bearing Treasury Bond — 2 years, 24 Series (0.2-1.3%) |
2024-2026 | 2026-2028 | 67,345,947 | |||||||||
| 6% Bereaved Family Treasury Bond, 6 Series |
2017-2022 | 2026-2031 | 1 | |||||||||
| Non-interest Special Benefit Treasury Bond IV, 1 Series |
2016 | 2026 | 0 | |||||||||
| Non-interest Special Benefit Treasury Bond X, 1 Series |
2016 | 2026 | 1 | |||||||||
| Non-interest Special Benefit Treasury Bond XIII, 1 Series |
2021 | 2026 | 9 | |||||||||
| Non-interest Special Benefit Treasury Bond XVII, 1 Series |
2016 | 2026 | 12 | |||||||||
| Non-interest Special Benefit Treasury Bond XXII, 2 Series(a) |
2016-2017 | 2026-2027 | 60 | |||||||||
39
| Title and Interest Rate |
Year of Issue | Year of Maturity | Principal Amounts Outstanding as of March 31, 2026 (in millions) | ||||||||||||
| Non-interest Special Benefit Treasury Bond XXVII, 6 Series(a) |
2016-2022 | 2026-2032 | 390 | ||||||||||||
| Non-interest Special Benefit Treasury Bond XXIX, 1 Series |
2021 | 2026 | 36 | ||||||||||||
| Non-interest Treasury Bond for Special Condolence XI, 1 Series |
2020 | 2025 | 0 | ||||||||||||
| Non-interest Special Benefit Treasury Bond XXX, 3 Series(a) |
2023-2025 | 2028-2030 | 1,785 | ||||||||||||
|
|
|
||||||||||||||
| Non-interest Treasury Bond for Special Condolence XII, 1 Series |
2025 | 2030 | 68,886 | ||||||||||||
|
|
|
||||||||||||||
| Total Bonds |
¥ | 1,151,291,324 | |||||||||||||
|
|
|
||||||||||||||
| 2. Borrowings |
|||||||||||||||
| Former Temporary Military Expenditure(b) |
1943-1945 | ¥ | 41,422 | ||||||||||||
| Allotment of Local Allocation and Local Transfer Tax |
2007 | 2037 | 6,422,696 | ||||||||||||
| Former National Centers for Advanced and Specialized Medical Care |
2010 | 2026-2035 | 6,624 | ||||||||||||
| Special Account for Energy Policy (0.01-2.2 %) |
2014-2026 | 2026-2040 | 68,074 | ||||||||||||
| Special Account for Stable Food Supply (0.0-2.1%) |
2014-2026 | 2027-2039 | 15,048 | ||||||||||||
| Special Account for National Forest Debt Management (0.0-1.632%) |
1996-2026 | 2026-2033 | 1,034,537 | ||||||||||||
| Special Account for Motor Vehicle Safety (0.0-2.3%) |
2005-2026 | 2027-2041 | 780,284 | ||||||||||||
| Total Borrowings |
¥ | 8,368,686 | |||||||||||||
|
|
|
||||||||||||||
| Total Direct Internal Funded Debt |
¥ | 1,159,660,010 | |||||||||||||
|
|
|
||||||||||||||
| (a) | The amounts outstanding for Non-interest Special Benefit Treasury Bond XXVII, 6 Series, and for Non-interest Special Benefit Treasury Bond XXX, 3 Series are higher than the amounts outstanding for the other Non-interest Special Benefit Treasury Bond series listed in this table because these bonds relate to “special benefit for the wives of the war dead, etc.”, for which benefit payments are high compared to other special benefits. |
| (b) | Represents borrowings by the government from special corporations of currencies of areas under Japanese control during World War II. The maturity of such borrowings and other matters relating to such borrowings remain undetermined. |
40
Floating Debt
| Title |
Interest | Year of Maturity |
Principal Amounts Outstanding as of March 31, 2026 (in millions) |
|||||||||||
| 1. Bonds |
||||||||||||||
| Treasury Discount Bills |
||||||||||||||
| Foreign Exchange Fund Financing Bills |
Non-interest bearing | 2026 | 91,139,070 | |||||||||||
| Petroleum Financing Bills |
Non-interest bearing | 2026 | 1,160,400 | |||||||||||
| Treasury Bills, 15 Series |
Non-interest bearing | 2026-2027 | 43,999,650 | |||||||||||
| Note in Substitution for Currency of the International Monetary Fund |
Non-interest bearing | Payable on demand | 4,356,241 | |||||||||||
| Note for Contribution to the Special Funds of the Asian Development Bank |
Non-interest bearing | Payable on demand | 3,709 | |||||||||||
| Note in Substitution of Currency for the) Multilateral Investment Fund of the Inter-American Development Bank |
Non-interest bearing | Payable on demand | 3,220 | |||||||||||
| Note in Substitution for Currency of the African Development Fund |
Non-interest bearing | Payable on demand | 48,820 | |||||||||||
| Note in Substitution for Currency of the International Fund for Agricultural Development |
Non-interest bearing | Payable on demand | 3,955 | |||||||||||
| Note in Substitution for Currency of the Global Environment Facility Trust Fund of the International Bank for Reconstruction and Development |
Non-interest bearing | Payable on demand | 54,208 | |||||||||||
| Note in Substitution for Currency of the Multilateral Investment Guarantee Agency |
Non-interest bearing | Payable on demand | 721 | |||||||||||
| Note in Substitution for Currency of the Green Climate Fund |
Non-interest bearing | Payable on demand | 57,669 | |||||||||||
| Government Bonds issued to Development Bank of Japan |
Non-interest bearing | Payable on demand | 1,324,665 | |||||||||||
| Government Bonds issued to Nuclear Damage Liability Facilitation Fund |
Non-interest bearing | Payable on demand | ¥ | 3,899,700 | ||||||||||
| (in USD millions) | ||||||||||||||
| Demand Note for Contributions to the Advancing Needed Credit Enhancement for Ukraine Trust Fund |
Non-interest bearing | Payable on demand | $ | 12,500 | ||||||||||
|
|
|
|||||||||||||
| Demand Note for Contributions to the Portfolio Guarantee Platform Trust Fund |
Non-interest bearing | Payable on demand | $ | 1,000 | ||||||||||
|
|
|
|||||||||||||
| Note in Substitution for Currency of the Inter-American Investment Corporation |
Non-interest bearing | Payable on demand | $ | 110 | ||||||||||
|
|
|
|||||||||||||
| Total Bonds |
¥ | 146,052,027 | ||||||||||||
| $ | 13,610 | |||||||||||||
|
|
|
|||||||||||||
| 2. Borrowings |
||||||||||||||
| Special Account for Local Allocation Tax |
0.7-1.7 | % | 2026 | ¥ | 25,517,846 | |||||||||
| Special Account of Pension |
1.7 | % | 2026 | 1,430,617 | ||||||||||
| Special Account for Energy Policy |
0.661-1.298 | % | 2026-2027 | 8,137,898 | ||||||||||
|
|
|
|||||||||||||
| Total Borrowings |
¥ | 35,086,361 | ||||||||||||
| Total Direct Internal Floating Debt |
¥ | 182,007,687 | ||||||||||||
| $ | 13,610 | |||||||||||||
|
|
|
|||||||||||||
| Total Direct Internal Debt |
¥ | 1,341,667,697 | ||||||||||||
| $ | 13,610 | |||||||||||||
|
|
|
|||||||||||||
41
Debt Guaranteed by the Japanese Government
| Title |
Interest | Year of Issue | Year of Maturity |
Principal Amounts Outstanding as of March 31, 2026 (in millions) |
||||||||||||
| 1. Bonds Issued by Government-Affiliated Corporations |
||||||||||||||||
| Japan Finance Corporation |
0.010-0.209% | 2016-2021 | 2026-2031 | ¥ | 180,000 | |||||||||||
| Japan Expressway Holding and Debt Repayment Agency |
0.001-3.080% | 2006-2026 | 2026-2061 | 10,516,500 | ||||||||||||
| Japan Housing Finance Agency |
0.001-2.564% | 2021-2026 | 2026-2054 | 995,000 | ||||||||||||
| New Kansai International Airport Company, Ltd. |
0.105-2.400% | 2007-2019 | 2027-2029 | 110,100 | ||||||||||||
| Development Bank of Japan |
0.001-2.253% | 2016-2026 | 2026-2062 | 910,000 | ||||||||||||
| Deposit Insurance Corporation of Japan |
0.311-0.792% | 2024-2025 | 2026-2027 | 160,000 | ||||||||||||
| Japan Investment Corporation |
0.409-1.679% | 2024-2026 | 2026-2030 | 600,000 | ||||||||||||
| Nuclear Damage Compensation and Decommissioning Facilitation Corporation |
0.001-0.924% | 2022-2025 | 2026-2028 | 800,000 | ||||||||||||
| Private Finance Initiative Promotion Corporation of Japan |
0.001-0.145% | 2017-2021 | 2026-2027 | 88,000 | ||||||||||||
| Japan Overseas Infrastructure Investment Corporation for Transport & Urban Development |
0.695% | 2023 | 2033 | 5,000 | ||||||||||||
| Fund Corporation for the Overseas Development of Japan’s ICT and Postal Services Inc. |
0.110-0.504% | 2021-2022 | 2031-2032 | 20,000 | ||||||||||||
| Organization for Promoting Urban Development |
0.145-3.112% | 2017-2026 | 2027-2055 | 264,000 | ||||||||||||
| Central Japan International Airport Co., Ltd. |
0.001-1.675% | 2017-2026 | 2027-2042 | 142,900 | ||||||||||||
| Japan Finance Organization for Municipalities |
0.001-1.104% | 2016-2025 | 2026-2030 | 1,435,000 | ||||||||||||
|
|
|
|||||||||||||||
| Total |
¥ | 16,226,500 | ||||||||||||||
|
|
|
|||||||||||||||
| 2. Borrowings of Government-Affiliated Corporations |
||||||||||||||||
| Incorporated Administrative Agency — Farmers Pension Fund |
0.668-0.998% | 2025-2026 | 2026-2027 | ¥ | 108,900 | |||||||||||
| Japan Organization for Metals and Energy Security |
0.795-1.079% | 2025-2026 | 2026-2027 | 904,911 | ||||||||||||
| Deposit Insurance Corporation of Japan |
0.698-0.869% | 2025 | 2026 | 162,000 | ||||||||||||
| Japan Investment Corporation |
0.697-0.826% | 2025 | 2026 | 500,000 | ||||||||||||
| Nuclear Damage Compensation and Decommissioning Facilitation Corporation |
0.714-0.804% | 2025 | 2026 | 200,000 | ||||||||||||
| The Corporation for Revitalizing Earthquake-Affected Business |
0.850% | 2025 | 2026 | 1,600 | ||||||||||||
| Organization for Cross-regional Coordination of Transmission Operators, Japan |
0.806% | 2025 | 2026 | 470,000 | ||||||||||||
| Regional Economy Vitalization Corporation of Japan |
0.794% | 2025 | 2026 | 33,900 | ||||||||||||
| Organization for Promoting Urban Development |
0.973-1.668% | 2025-2026 | 2029-2030 | 9,300 | ||||||||||||
|
|
|
|||||||||||||||
| Total |
¥ | 2,390,611 | ||||||||||||||
| Total Internal Debt Guaranteed by the Japanese Government |
¥ | 18,617,111 | ||||||||||||||
|
|
|
|||||||||||||||
42
Debt Guaranteed by the Japanese Government
| Interest | Year of Loan | Year of Maturity |
Principal Amounts Outstanding as of March 31, 2026 (in thousands) | |||||||||||||||||
| Japan Bank for International Cooperation |
1.625-4.875% | 2016-2026 | 2026-2036 | $ | 29,300,000 | |||||||||||||||
| 0.375-4.625% | 2021-2025 | 2026-2030 | £ | 600,000 | ||||||||||||||||
| 1.500-3.125% | 2022-2024 | 2028-2030 | € | 2,500,000 | ||||||||||||||||
| Japan International Cooperation Agency |
1.000-4.750% | 2016-2025 | 2026-2031 | $ | 6,730,000 | |||||||||||||||
| Development Bank of Japan |
1.000-4.875% | 2016-2026 | 2026-2036 | $ | 12,050,000 | |||||||||||||||
| 3.125-4.750% | 2007-2023 | 2027-2028 | € | 1,700,000 | ||||||||||||||||
| 1.810% | 1998 | 2028 | ¥ | 25,000,000 | ||||||||||||||||
|
|
|
|||||||||||||||||||
| Totals by currency |
$ | 48,080,000 | ||||||||||||||||||
| £ | 600,000 | |||||||||||||||||||
| € | 4,200,000 | |||||||||||||||||||
| ¥ | 25,000,000 | |||||||||||||||||||
43
SUBSCRIPTIONS TO INTERNATIONAL FINANCIAL ORGANIZATIONS
The following table sets forth information relating to Japan’s obligations to contribute to the capital and financing requirements of international financing organizations in which it participates as of March 31, 2026.
| Organization |
Subscription Amount | ||||
| (in USD millions) | |||||
| International Monetary Fund |
$ | 41,769(a) | |||
| International Bank for Reconstruction and Development |
$ | 24,113(b) | |||
| International Development Association |
$ | 52,322(c) | |||
| International Finance Corporation |
$ | 1,800(d) | |||
| Multilateral Investment Guarantee Agency |
$ | 97(e) | |||
| Asian Development Bank |
$ | 22,708(f) | |||
| Inter-American Development Bank |
$ | 8,878(g) | |||
| Multilateral Investment Fund |
$ | 695(h) | |||
| Inter-American Investment Corporation |
$ | 119(i) | |||
| African Development Bank |
$ | 10,898(j) | |||
| African Development Fund |
$ | 5,190(k) | |||
| European Bank for Reconstruction and Development |
€ | 2,900(l) | |||
| International Fund for Agricultural Development |
$ | 662(m) | |||
| (a) | Equivalent of SDR 30,820.5 million and 1SDR=1.356100 USD as of June 30, 2026. |
| (b) | As stated in IBRD Financial Statements as of June 30, 2025. |
| (c) | As stated in IDA Financial Statements as of June 30, 2025. |
| (d) | As stated in IFC Financial Statements as of June 30, 2025. |
| (e) | As stated in MIGA Financial Statements as of June 30, 2025. |
| (f) | As stated in ADB Financial Statements as of December 31, 2025. |
| (g) | As stated in IDB Financial Statements as of December 31, 2025. |
| (h) | As stated in MIF Financial Statements as of December 31, 2025. |
| (i) | As stated in IIC Financial Statements as of December 31, 2025. |
| (j) | As stated in AfDB Financial Statements as of December 31, 2025. Equivalent of UA 7,958 million. |
| (k) | As stated in AfDF Financial Statements as of December 31, 2025. Equivalent of UA 3,790 million. |
| (l) | As stated in EBRD Financial Statements as of December 31, 2025. |
| (m) | As stated in IFAD Financial Statements as of December 31, 2024. |
44