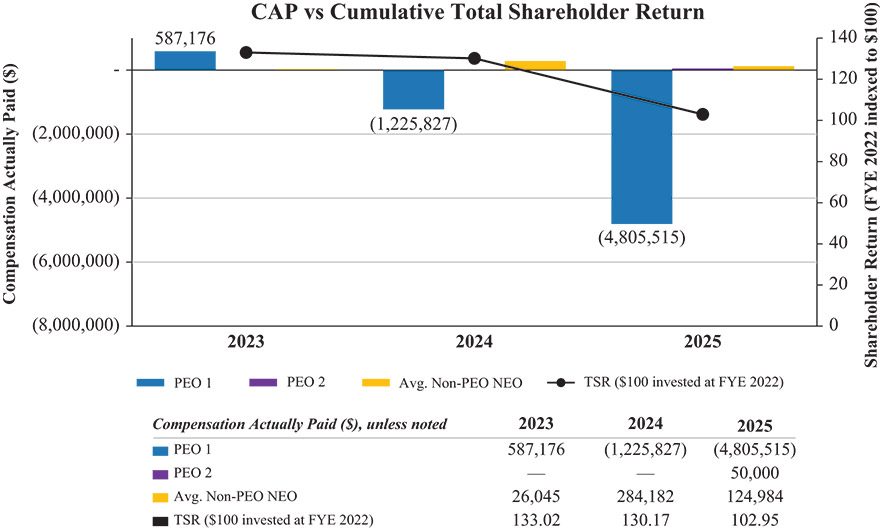
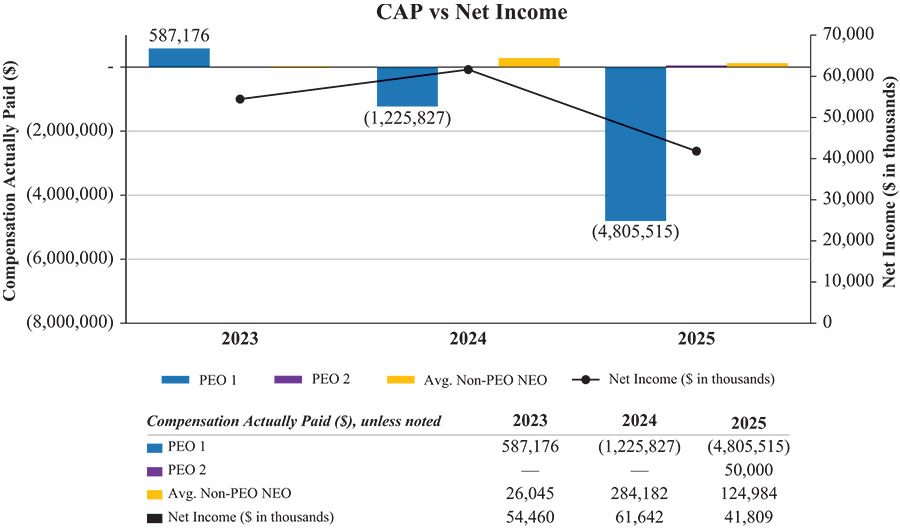
Pay vs Performance Disclosure - USD ($)
Dec. 31, 2025
Oct. 09, 2025
Dec. 31, 2025
Dec. 31, 2024
Dec. 31, 2023
| Year | | | Summary Compensation Total for R. Duncan Bates ($)(1) | | | Compensation Actually Paid to R. Duncan Bates ($)(2) | | | Summary Compensation Total for Kenneth E. Shipley ($)(1) | | | Compensation Actually Paid to Kenneth E. Shipley ($)(2) | | | Average Summary Compensation Table Total for Non-PEO NEOs ($)(3) | | | Average Compensation Actually Paid to Non-PEO NEOs ($)(4) | | | Value of Initial Fixed $100 Investment Based On: Cumulative Total Shareholder Return ($)(5) | | | Net Income (in thousands) ($)(6) | | ||||||||||||||||||||||||
| 2025 | | | | | 354,699 | | | | | | (4,805,515) | | | | | | 50,000 | | | | | | 50,000 | | | | | | 153,568 | | | | | | 124,984 | | | | | | 102.95 | | | | | | 41,809 | | |
| 2024 | | | | | 330,000 | | | | | | (1,225,827) | | | | | | | | | | | | | | | | 157,660 | | | | | | 284,182 | | | | | | 130.17 | | | | | | 61,642 | | | ||
| 2023 | | | | | 400,000 | | | | | | 587,176 | | | | | | | | | | | | | | | | 219,171 | | | | | | 26,045 | | | | | | 133.02 | | | | | | 54,460 | | | ||
(1)
During 2025, our PEOs were Kenneth E. Shipley and Duncan Bates. During 2023 and 2024, our PEO was Duncan Bates.
(2)
The dollar amounts reported in this column represent the amount of “compensation actually paid” to Messrs. Bates and Shipley as computed in accordance with Item 402(v) of Regulation S-K. The amounts do not reflect the actual amount of compensation earned by or paid to Messrs. Bates and Shipley during the applicable year. In accordance with the requirements of Item 402(v) of Regulation S-K, the adjustments reflected in this table were made to Mr. Bates’ and Mr. Shipley’s total compensation for 2025 to determine the compensation actually paid:
Adjustments to the Summary Compensation Table Total to arrive at CAP for our PEO are shown below. No adjustments were necessary for defined benefit and pension plans or dividends. The assumptions used for determining the fair values shown in this table are consistent with those used to determine the fair values disclosed as of the grant date of such awards.
| Name | | | Summary Compensation Total for PEO ($) | | | Less: Grant Date Fair Value of Equity Awards Granted in Fiscal Year ($) | | | Plus: Fair Value of Unvested Equity at Fiscal Year End (Current Year Awards) ($) | | | Plus: Increase / (Decrease) in Fair Value of Equity Vested During Fiscal Year ($) | | | Plus: Increase / (Decrease) in Fair Value of Unvested Equity at Fiscal Year End ($) | | | Plus: Increase / (Decrease) in Fair Value of Equity Vested During Fiscal Year (Prior Year Awards) ($) | | | Less: Fair Value of Equity Awards at Prior Year-End Forfeited in Current Fiscal Year ($) | | | Compensation Actually Paid to PEO ($) | | ||||||||||||||||||||||||
| R. Duncan Bates | | | | | 354,699 | | | | | | | | | | | | | | | | | | | | | | | | | | (480,959) | | | | | | (4,679,255) | | | | | | (4,805,515) | | | ||||
| Kenneth E. Shipley | | | | | 50,000 | | | | | | | | | | | | | | | | | | | | | | | | | | | | | | | | | | | | 50,000 | | | ||||||
(3)
During 2025, our Non-PEO NEOs were Curtis D. Hodgson, Jon A. Langbert, Ronald C. Arrington and Jeffrey M. Fiedelman; during 2024, our Non-PEO NEOs were Curtis D. Hodgson, Kenneth E. Shipley and Jeffrey M. Fiedelman; during 2023, our Non-PEO NEOs were Curtis D. Hodgson, Kenneth E. Shipley, Jeffrey V. Burt, Ronald C. Arrington and Jeffrey M. Fiedelman.
(4)
The dollar amounts reported in this column represent the average amount of “compensation actually paid” to the Non-PEO NEOs as a group as identified in footnote 3 above, as computed in accordance with Item 402(v) of Regulation S-K. The dollar amounts do not reflect the actual average of compensation earned by or paid to these NEOs as a group during the applicable year. In accordance with the requirements of Item 402(v) of Regulation S-K, the following adjustments were made to the average total compensation for these NEOs as a group for 2025 to determine the compensation actually paid:
Adjustments to the Summary Compensation Table Total to arrive at CAP for non-PEO NEOs (shown as an average) are presented below. No adjustments were necessary for defined benefit and pension plans or dividends.
| Year | | | Average Summary Compensation Total for Non-PEO NEOs ($) | | | Less: Grant Date Fair Value of Equity Awards Granted in Fiscal Year ($) | | | Plus: Fair Value of Unvested Equity at Fiscal Year End (Current Year Awards) ($) | | | Plus: Increase / (Decrease) in Fair Value of Equity Vested During Fiscal Year ($) | | | Plus: Increase / (Decrease) in Fair Value of Unvested Equity at Fiscal Year End ($) | | | Plus: Increase / (Decrease) in Fair Value of Equity Vested During Fiscal Year (Prior Year Awards) ($) | | | Less: Fair Value of Equity Awards at Prior Year-End Forfeited in Current Fiscal Year ($) | | | Average Compensation Actually Paid to Non-PEO NEOs ($) | | ||||||||||||||||||||||||
| 2025 | | | | | 153,568 | | | | | | (46,026) | | | | | | 53,148 | | | | | | | | | | | | | | | | | | | | | (35,707) | | | | | | 124,984 | | | |||
(5)
Cumulative total shareholder return is calculated by dividing the sum of the cumulative amount of dividends for the measurement period, assuming dividend reinvestment, and the difference between the share price at the end and the beginning of the measurement period by the share price at the beginning of the measurement period. For purposes of these amounts, the beginning of the measurement period is December 31, 2022.
(6)
The dollar amounts reported represent the amount of net income reflected in our Company’s audited financial statements for the applicable year.
(1)
During 2025, our PEOs were Kenneth E. Shipley and Duncan Bates. During 2023 and 2024, our PEO was Duncan Bates.
(3)
During 2025, our Non-PEO NEOs were Curtis D. Hodgson, Jon A. Langbert, Ronald C. Arrington and Jeffrey M. Fiedelman; during 2024, our Non-PEO NEOs were Curtis D. Hodgson, Kenneth E. Shipley and Jeffrey M. Fiedelman; during 2023, our Non-PEO NEOs were Curtis D. Hodgson, Kenneth E. Shipley, Jeffrey V. Burt, Ronald C. Arrington and Jeffrey M. Fiedelman.
(2)
The dollar amounts reported in this column represent the amount of “compensation actually paid” to Messrs. Bates and Shipley as computed in accordance with Item 402(v) of Regulation S-K. The amounts do not reflect the actual amount of compensation earned by or paid to Messrs. Bates and Shipley during the applicable year. In accordance with the requirements of Item 402(v) of Regulation S-K, the adjustments reflected in this table were made to Mr. Bates’ and Mr. Shipley’s total compensation for 2025 to determine the compensation actually paid:
Adjustments to the Summary Compensation Table Total to arrive at CAP for our PEO are shown below. No adjustments were necessary for defined benefit and pension plans or dividends. The assumptions used for determining the fair values shown in this table are consistent with those used to determine the fair values disclosed as of the grant date of such awards.
| Name | | | Summary Compensation Total for PEO ($) | | | Less: Grant Date Fair Value of Equity Awards Granted in Fiscal Year ($) | | | Plus: Fair Value of Unvested Equity at Fiscal Year End (Current Year Awards) ($) | | | Plus: Increase / (Decrease) in Fair Value of Equity Vested During Fiscal Year ($) | | | Plus: Increase / (Decrease) in Fair Value of Unvested Equity at Fiscal Year End ($) | | | Plus: Increase / (Decrease) in Fair Value of Equity Vested During Fiscal Year (Prior Year Awards) ($) | | | Less: Fair Value of Equity Awards at Prior Year-End Forfeited in Current Fiscal Year ($) | | | Compensation Actually Paid to PEO ($) | | ||||||||||||||||||||||||
| R. Duncan Bates | | | | | 354,699 | | | | | | | | | | | | | | | | | | | | | | | | | | (480,959) | | | | | | (4,679,255) | | | | | | (4,805,515) | | | ||||
| Kenneth E. Shipley | | | | | 50,000 | | | | | | | | | | | | | | | | | | | | | | | | | | | | | | | | | | | | 50,000 | | | ||||||
(4)
The dollar amounts reported in this column represent the average amount of “compensation actually paid” to the Non-PEO NEOs as a group as identified in footnote 3 above, as computed in accordance with Item 402(v) of Regulation S-K. The dollar amounts do not reflect the actual average of compensation earned by or paid to these NEOs as a group during the applicable year. In accordance with the requirements of Item 402(v) of Regulation S-K, the following adjustments were made to the average total compensation for these NEOs as a group for 2025 to determine the compensation actually paid:
Adjustments to the Summary Compensation Table Total to arrive at CAP for non-PEO NEOs (shown as an average) are presented below. No adjustments were necessary for defined benefit and pension plans or dividends.
| Year | | | Average Summary Compensation Total for Non-PEO NEOs ($) | | | Less: Grant Date Fair Value of Equity Awards Granted in Fiscal Year ($) | | | Plus: Fair Value of Unvested Equity at Fiscal Year End (Current Year Awards) ($) | | | Plus: Increase / (Decrease) in Fair Value of Equity Vested During Fiscal Year ($) | | | Plus: Increase / (Decrease) in Fair Value of Unvested Equity at Fiscal Year End ($) | | | Plus: Increase / (Decrease) in Fair Value of Equity Vested During Fiscal Year (Prior Year Awards) ($) | | | Less: Fair Value of Equity Awards at Prior Year-End Forfeited in Current Fiscal Year ($) | | | Average Compensation Actually Paid to Non-PEO NEOs ($) | | ||||||||||||||||||||||||
| 2025 | | | | | 153,568 | | | | | | (46,026) | | | | | | 53,148 | | | | | | | | | | | | | | | | | | | | | (35,707) | | | | | | 124,984 | | | |||